Daily Grape Juice Consumption Promotes Weight Loss, Improved Stability and Reduced the DNA Damage in the Elderly
Abstract
The aim of this study was to determine the influence of chronic supplementation with grape juice (400ml), in modulating the anthropometric and biochemical parameters. Thirty-nine seniors participated and were evaluated at baseline after 30 days. The chronic consumption of grape juice reduced weight, BMI and waist circumference. Indeed, the consumption modulated biochemical parameters, decreased the total cholesterol levels, Low-density lipoprotein (LDL) cholesterol, Urea and GGT. In addition, the intake of juice improved the performance in the TUG test, and caused more stability in the elderly. The levels of protein oxidation declined and the antioxidant potential significantly increased as well as SOD and the ratio SOD / CAT. In contrast, levels reduced sulfhydryl groups to consumption. In nuclear changes there are a decrease in the frequency of MN and picnosis. In conclusion, grape juice could be an excellent option to improve quality of life in elderly.
Author Contributions
Academic Editor: Tianbao Yang, USDA-ARS Food Quality Laboratory, USA.
Checked for plagiarism: Yes
Review by: Single-blind
Copyright © 2020 Pedro Cañete da Costa, et al.
 This is an open-access article distributed under the terms of the Creative Commons Attribution License, which permits unrestricted use, distribution, and reproduction in any medium, provided the original author and source are credited.
Competing interests
The authors have no conflicts of interest to declare.
Citation:
Introduction
In Brazil, specifically in the south part of the country, grape juice is produced from the varieties Bordo, Isabel and Concord. According to the literature, this product is rich in phenolic compounds, including catechins, anthocyanins and resveratrol1,2,3,4. Many health benefits have been attributed to the regular consumption of grape juice because of the phenolic compounds present5,6. Among the many benefits are hepatoprotection7,8, neuroprotection5,9,10,11 and cardioprotection12,13.
Some studies showed the polyphenols and its products to stimulate energy metabolism14, and inhibit the lipase action15. Catechins could influence positively to the weight loss or maintenance, based on meta-analysis.16 In addition, some studies exhibited that the consumption of drinks rich in polyphenols promoted weight loss17,18, body mass index reduction (BMI)18,19 and decreased the waist circumference (WC)17,18.
Besides the possibility of weight loss, some other studies have shown that consumption of grape derivatives, including wine and grape juice can modulate biochemical parameters, such as otimal regulation in the total cholesterol level as well as low of total cholesterol, low density lipoprotein (LDL) and high density lipoprotein (HDL)6,13,20,21,22.
All this findings, weight loss and biochemical parameters reduction, could benefit human life, especially the elderly. According to the World Health Organization (WHO), in 2050, the world might have at least 2 billion elderly23. These numbers reinforce the need for further research involving food and alternative forms of consumption, to assist the welfare and treatment of chronic diseases in the elderly.
The aging is due to two independent processes, the first progressive deterioration of physiological function and confronting to the difficult adaptation to oxidative stress (OS)12. These processes relate to changes over time that generally are a decline in metabolic function, diminished homeostasis and increased likelihood of acquiring degenerative diseases13. Some of these disorders are often attributed to OS, where the endogenous antioxidant capacity is ineffective in combating the formation of free radicals with subsequent formation of OS14,15.
In older people, mainly women, obesity accelerates the decline of physical function, which is associated with aging and promotes adverse effects on chronic disease risk24. The aging process has a negative effect on physical function and results in decreased muscular strength. However, an exercise program combined with behavioral-based dietary intervention has been shown to significantly improve function and body composition24,25,26.
Studies on OS, in young people showed that grape juice consumption (after dinner) and apple (after lunch) for two weeks, improved the antioxidant mechanism and reduced the incidence of OS and related disorders27. In addition to lowering the levels of OS, it has been found that grape juice consumption also attributed in reducing of levels of DNA damage in different cases 7,17.
OS is an important triggering factor of oxidative DNA damage and may act as a possible risk factor for development of cancer28. These changes can result in chromosomal breakage and interfere with the process of mitosis, which generates micronuclei19 or even condensed chromatin and form a pyknotic nucleus. Pyknosis, karyorrhexis and karyolysis are evident necrosis in cells, which is a form of cell death that occurs after injury by agents whereby affect the intracellular20.
Based on this, the present study aimed to determine if chronic supplementation with grape juice, for thirty days, modulates the anthropometric parameters, oxidative stress, nuclear alterations, stability and the biochemical profile in the elderly.
Materials and Methods
Grape Juice
Grape juice used was the integral grape juice gently provided by Suvalan® brand, packaging of 200ml, all from the same batch (1771-13). Throughout the tests, we observed the expiration dates of the juice, phenolic compounds and chemical analysis.
Grape Juice Analyzes
Alcoholic degree, total acidity, volatile acidity and pH were determined using the methods described by Zoecklein et al. (1999)29. All analyzes were performed in duplicate.
Total phenol content was measured using Singleton and Rossi’s modification of Folin–Ciocalteau’s colorimetric method30. Total phenolic content was showed in mg catechin/ml. High performance liquid chromatography (HPLC) analysis was used to quantify the presence of individual phenolic compounds. Before HPLC analysis, 5 mL of each sample were filtered through a 0.20-mm cellulose membrane. The equipment consisted of a liquid-gradient chromatographic system, LC-DAD Series 1100 (Palo Alto, CA), with diode array (DAD) detector system. Zorbax 300 SB C18 pre-column (12 mm·4.6 mm·5lm) and C18-ODS column (150 mm·4mm·5lm) (Agilent Technologies, USA) were used. Total isolated polyphenols were showed in mg/L.
Subjects
Sample size was set according to other studies performed in humans and with the aid of Winpepi program, considering 30% coefficient of variation, 90% power and a 0.05 significance level. Recent studies show a number of approximately 25 individuals12,20,22,31.
The authors invited the elderly people through posters in hospitals and social networks. Excluded from the study were volunteers under sixty years old, that had neurodegenerative disease, diabetes (both types) and smokers. All participants read and signed the Informed Consent (IC), according to Resolution 466/12 of the National Health Council. The Research Ethics Committee of the Centro Universitário Metodista - IPA, approved the study under protocol 900,767.
Forty-one elderly over sixty years old were interested in participating in the research, but there were two withdrawals and thirty-nine completed the study (n = 39). The terminations occurred in the first week of research, the first abandoned for experiencing accentuated epigastric pain and linked this to grape juice consumption, and the second, needed to have surgery, there were no more reports. The volunteers were instructed to keep the same routine regarding to diet, exercises and medication during the thirty days of research to prevent possible confounders, any changes should be reported to researchers in the end, and there were no reports.
Experimental Design
The survey was conducted in three meetings. At the first one the mechanism of the rules and the criteria for the blood collection day were explained, reinforcing the need for fasting; the other two meetings were divided into start and end, following according to Figure 1. In these two meetings, the blood samples and anthropometric measurements were collected and the Timed Up and Go (TUG) test was performed. The volunteers received all the required amount of juice for the thirty days of research in the initial meeting. All the volunteers consumed 400ml daily.
Figure 1.Flowchart of experimental design in the initial and final meetings.
For remembrance and security, we sent e-mails and text messages, as well as phone calls to the volunteers with the aim to remind them of the consumption requirements.
Evaluation of Anthropometric Parameters
These parameters were analyzed in the start and end time. Semi-analytical Balance Welmy with coupled stadiometer evaluated the height (m and weight (kg). The waist circumference (cm) and hip circumference (cm) were measured with a tape. BMI (kg/m2) was obtained using the formula weight/m2. The investigators responsible for these measures were the same, before and after the intervention.
Stability Body Assessment
To measure physical performance using the Time Up and Go test (TUG test), each individual was asked to stand up from a seated position, walk 3 m and then return to a seated position on the same chair, while a previously trained physical therapist measured the time (s) required to perform this task32. The test evaluation criteria are as follows: less than 10 seconds: low risk for falling; 10-20s: medium risk for falls; up 20s: high risk for falls. The TUG has a good reliability33 and is recommended by the American Geriatric Society as a screening test and as a routine for evaluating risk for falls34.
Evaluation of Biochemical Parameters
For the biochemical parameters, venous blood samples (20ml) were collect, without anticoagulant, after 12 hours fasting, one at the beginning of the study and another at the end (30 days after consumption). After the harvest, the blood was centrifuged for 10 minutes at 500x g to obtain the serum. The serum aliquot was separated and frozen until the analyzes. All the parameters were analyzed using the commercial kit`s Bioclin® brand and analyzed with an automatic reader. The biochemical parameters examined were total cholesterol (mg/dl), triglycerides (mg/dl), HDL cholesterol (mg/dl), LDL cholesterol (mg/dl), alanine aminotransferase (ALT) (U/L), aspartate aminitransferase (AST) (U/L), gamma-glutamyl transferase (GGT) (U/L), urea (mg/dl) and creatinine (mg/dl). The LDL cholesterol values were obtained by the Friedewald formula, {LDL cholesterol = total cholesterol - (VLDL + HDL)}, with VLDL = Triglycerides / 5. This formula was used for triglyceride levels up to 400 mg/dL. All of the analyzes had triglyceride levels below 400 mg/dL.
Parameters of Oxidative Stress
To measure these parameters was collected venous blood sample (20ml) without anticoagulant, an initial and one end (30 days after consumption). Immediately after the blood samples were centrifuged (500x g, 10 minutes) to obtain the serum, a serum aliquot was separated into microtube identified, frozen and subsequently analyzed.
For the levels of lipid peroxidation, we used the test to evaluate the reactive substances to thiobarbituric acid (TBARS). These are generated by a heated acidic reaction. This method is considered sensitive to quantitate levels of lipid peroxidation, as previously described by Wills (1966)35. In general, samples were mixed with 10% trichloroacetic acid (TCA) and 0.67% thiobarbituric acid (TBA) and then were heated in boiling water bath for 15 minutes in sealed tubes. The TBARS was determined by absorbance at 535 nm. The results were expressed in nmol / mg protein.
Oxidative damage to proteins was measured by determining the carbonyl groups and is based on the reaction with dinitrophenylhydrazine (DNPH) according to Levine et al (1990). The DNPH reacts with protein carbonyls to form hydrazones which can be measured spectrophotometrically at 370 nm. The results were expressed in nmol / mg protein36.
Defenses were determined by non-enzymatic sulfhydryl technique. This assay is based on the reduction of 5,5'-dithio-bis (2-nitrobenzoic acid) (DTNB) by thiol groups, generating a yellow compound (TNB) which is its absorbance determined spectrophotometrically at 405 nm37.The sulfhydryl content is inversely correlated to protein oxidative damage. The results were expressed in nmol / mg protein.
The activity of superoxide dismutase (SOD) was determined spectrophotometrically by measuring the inhibition of adenocromo formation rate autocatalytic at 480 nm (SP-2200 Spectrophotometer, Bioespectro Curitiba, Brazil) in a reaction medium containing 1mM adrenaline and 50 mM glycine38. The results were expressed as U SOD / mg of protein. The assay for assessing the activity of catalase (CAT) was performed according to the method described by Aebi (1984), which determines the rate of hydrogen peroxide decomposition (H2O2) to 240 nm (spectrophotometer SP-2200, Bioespectro). The results were expressed as U CAT / mg protein39.
To measure the total antioxidant potential technique was performed Ferric Reducing Antioxidant Power (FRAP), for these parameters was collected a venous blood sample (10ml) with anticoagulant, an initial and one final (30 days of consumption). Soon after the blood samples was centrifuged (500x g, 10 minutes) to obtain the plasma, a plasma aliquot was separated into microtube identified, frozen and later analyzed.40,41To embodiment was initially prepared FRAP reagent by mixing the reactants buffer 300mM acetate, 2,4,6-tri (2-pyridyl) -1,3,5-triazine (TPTZ) and sesquihydrate ferric chloride (FeCl3.6H2O) in proportion 10: 1: 1, respectively. Following, was added 100 ul of sample to 3 ml of the FRAP reagent and immediately held the first reading, the second reading was held after 4min. This reaction is based on the formation of Fe3 + complex with 2,4,6-tri (2-pyridyl) -1,3,5-triazine (TPTZ) and subsequent reduction in acid to its ferrous form (Fe2 +) by the presence of antioxidants, this reduction leads to a colorimetric change of the solution monitored spectrophotometrically at 593nm. Readings were taken in time and 0min 4min and the results were expressed in units FRAP reduced by the difference in the readings obtained (4min - 0min).
Nuclear Alterations of Oral Mucosa
The collection of cytogenetic material was performed by the smear of oral mucosa, using sterile and disposable materials following biosecurity standards. The material used for the buccal mucosa samples were brushes type cytobrush Plus (Kolplast Commercial Industrial Ltda, São Paulo, SP, Brazil). The anatomical area for collecting material was the right side edge of the inside of the mouth.
The collection was carried out after a previous rinse to remove bacteria or cellular debris that could interfere with or compromise the readings. The Falcon® 15mL tubes were identified and previously filled with saline 2mL (0.9% NaCl) and stored at 2 to 8 ° C. After collection of the brush materials were placed in Falcon® tube, packed and stored at the same temperature. Subsequently the samples were centrifuged (400 x g, 10min) after disregards the supernatant and add to the 1 mL more acetic acid methanolic solution precipitated with 3: 1 then the tubes were taken cooling for thirty minutes, after three blades were prepared for each identified participant. three drops of each tube and dripped on each blade to perform the smear were removed, they were allowed to dry at room temperature. The slides were stained by the technique of May-Grünwald / Giemsa (MGG) with 10% Giemsa solution (Merck, Darmstadt, Germany). The analysis of nuclear changes were made according to the criteria established. 2000 buccal mucosa cells were stained slides analyzed for each participant was quantified the number of cells that had micronuclei (MN), cariorrexes, picnólise or karyolysis were not counted binucleate cells and broken-egg. For this analysis we used the binocular optical microscope (Olympus CX31), to increase of 400 times belonging to the Laboratory of Hematology, this University Center.
Protein Dosage
Protein content was performed using the Biuret method. For this, we used the commercial kit Total Protein (Labtest Diagnostica A / S, Lagoa Santa, MG, Brazil), following the manufacturer's methodology.
Statistical Analyzes
The normal distribution of data was verified using the Kolmogorov-Smirnov test. To compare changes between baseline and final of grape juice consumption we used paired t-test for parametric variables and the data are presented as mean ± SD. For non-parametric variables a corresponding parametric Wilcoxon test was used, and data are presented as median (25th - 75th). The level of significance was set at p<0.05 for all analyzes. The SigmaStat and GraphPad Prism 5 software was use to creat the figures.
Results
Grape Juice
(Table 1) shows the principal characteristics of the grape juice used. The content of total polyphenols was 53.6±0.18 mg catechin / ml. The epicatechin and naringin appeared in higher concentrations. The physical and chemical parameters of the grape juice were expressed according to the to the Brazilian legislation.
Table 1. Grape Juice Characteristics| Analysis | Result | Method |
|---|---|---|
| Total Phenolic Compound (mg catechin /mL) | 53.6 ± 0.18 | Ribèrau-Gayon, 2003 [64] |
| trans-Resveratrol (mg/L) | 0.79 ± 0.01 | MCMurtrey et al., 1994 [65] |
| Catechin (mg/L) | 1.03 ± 0.03 | HPLC |
| Epicatechin (mg/L) | 5.38 ± 0.06 | HPLC |
| Naringin (mg/L) | 6.96 ± 0.21 | HPLC |
| Quercetin (mg/L) | 0.59 ± 0.06 | HPLC |
| Total Acidity (g % tartaric acid) | 0.54 ± 0.00 | IN nº24 08/09/2005 [66] |
| Volatile acidity (g/100g) | 0.00 | IN nº24 08/09/2005 [66] |
| º Brix | 14.28 ± 0.00 | IN nº24 08/09/2005 [66] |
| Relative density on 20ºC | 1.058 ± 0.00 | IN nº24 08/09/2005 [66] |
| Organoleptic Characteristics | Normal | IN nº24 08/09/2005 [66] |
| pH | 3.33 ± 0.01 | IN nº24 08/09/2005 [66] |
| Alcoholic grade (%v/v) | 0.00 | IN nº24 08/09/2005 [66] |
| Relation ºBrix/Total acidity (g % tartaric acid) | 26.44 ± 0.00 | IN nº24 08/09/2005 [66] |
Anthropometrics Parameters
Grape juice consumption for 30 days reduced significantly the weight (p = 0.01), BMI (p = 0.027) and WC (p = 0.047) in elderly patients, but did not change the hip circumference (p = 0.914) (Table 2).
Table 2. Characteristics and anthropometric results from individuals initial and final period after grape juice consumption.| Initial(n=39) | Final(n=39) | P | |
| Age (years) | 69.34 ± 6,88 | 69.34 ± 6.88 | - |
| Gender (M/ F) | 4/35 | 4/35 | - |
| Weight (kg) | 66.8 (58,35-76,6) | 65.7 (57.225-75.825) | 0.01* |
| Height (m) | 1.56 (1.523-1.627) | 1.56 (1.523-1.620) | - |
| BMI (kg/m2) | 27.73 (23.58-29.288) | 27.18 (23.439-29.297) | 0.027* |
| Waist Circumference (cm) | 93.50±11.5 | 91.93±9.99 | 0.047* |
| Hip Circumference (cm) | 105.05±9.21 | 105.10±9.087 | 0.914 |
Stability Test
The TUG test was conducted and the initial and final performance compared. Figure 2 shows the significant reduction in run time (p = 0.034), demonstrating an improvement in the test performance.
Figure 2.Comparison of the effect of grape juice consumption for 30 days in the stability of the volunteers. Data presented as mean±standard deviation.
Biochemical Parameters
Grape juice consumption significantly reduces the level of LDL cholesterol (p = 0.027) (Figure 3a) and total cholesterol (p = 0.012) (Figure 3b). No changes were observed in the levels of HDL (p = 0.914) (Figure 3c), triglycerides (p = 0.564) (Figure 3d) and glucose (p = 0.678) (Figure 3e).
Figure 3.Comparison of the effect of grape juice consumption for 30 days in the biochemical parameters of volunteers. TC (Total cholesterol), LDL (Low Density Lipoprotein), HDL (High density Lipoprotein). Data presented as mean ± standard deviation or median (25th - 75th). TC - total cholesterol.
We also noticed that the percentage of subjects with total cholesterol out of the reference values (> 200 mg / dl) decreased from 37.1% at baseline to 34.3% at the end, that shows in the end, 65.7% of the sample had values within normal in the end. Indeed, triglyceride levels, where the percentage of the sample out of the reference values (> 150mg / dl) decreased from 38.5% to 35.9% at the end, which represents 64.1% of the sample were the normal range with grape juice consumption
Renal markers, urea and creatinine are shown in Figure 4. Urea variable (Figure 4a) showed a significant statistical reduction at the end of grape juice consumption (p = 0.029). Creatinine variable (Figure 4b) did not change.
Figure 4.Comparison of the effect of grape juice consumption for 30 days in volunteers renal function markers. Data presented as mean±standard deviation (urea level) or median (25th - 75th) (Creatinine level).
Further, grape juice consumption reduces GGT levels (Figure 4c) at the end of consumption (p = 0.024). However, it did not modify other markers of liver function such as AST (Figure 5a) and ALT (Figure 5b).
Figure 5.Comparison of the effect of grape juice consumption for 30 days in volunteers hepatic function markers. ALT (Alanine aminotransferase), AST (Aspartate amitransferase), GGT (Gamma- glutamyl transferase). Data presented as mean±standard deviation (AST) or median (25th - 75th) (ALT and GGT).
Parameters of Oxidative Stress
The results of oxidative stress parameters are shown in Table 3. At the levels of lipid peroxidation as measured by the TBARS technique, there was no significant difference (p = 0.416) between the beginning and end of consumption. Since oxidative damage to protein as measured by the test Carbonyl there was a decrease in grape juice consumption (p = 0.020). The plasma antioxidant potential, measured by FRAP technique of reducing Fe3 + showed that the concentration of antioxidant compounds in plasma increased significantly (p = 0.003). Regarding the enzymatic activity, there was a significant difference in the levels of SOD (p = 0.010), significantly increasing its activity after consumption of grape juice, and the relationship SOD / CAT (p = 0.020), finding difference in the levels of CAT (p = 0.600). However, the levels of sulfhydryl groups significantly decreased (p = 0.020) at the end of the study.
Table 3. Comparison between start and end in oxidative stress parameters .| Initial | Final | p | |
| TBARS (nmol TBARS / mg protein) | 6.98 (5.68-16.47) | 10.09 (6.25-21.45) | 0.275 |
| Carbonil (nmol/mg protein) | 68.96±31.52 | 49.77±27.83 | 0.001 |
| Sulfidril (nmol TNB / mg protein) | 24.05±17.62 | 13.60±8.90 | 0.002 |
| SOD (U SOD/mg protein) | 40.2 (16.55-68.08) | 174.73 (72.5-232.3) | 0.01 |
| CAT (U CAT/mg protein) | 1.35 (0.77-2.06) | 1.01 (0.57-3.69) | 0.6 |
| SOD/CATFRAP (µmol/L) | 23.28 (10.04-86.47)0.171 (0.129-0.289) | 85.39 (28.10-606.07)0.353 (0.254-0.412) | 0.020.003 |
Nuclear Alterations
Nuclear alterations was observed a significant decrease in the frequency of MN (p = 0.035) and picnosis (p = 0.010) with no significant changes in the karyorrhexis type change counts (p = 0.683) and karyolysis (p = 0.100) (Figure 6).
Figure 6.Frequency (number of cells) of nuclear alterations in exfoliated buccal mucosa cells found in a total of 2,000 cells from each participant at the beginning (grey color) and end (black color) of the grape juice consumption.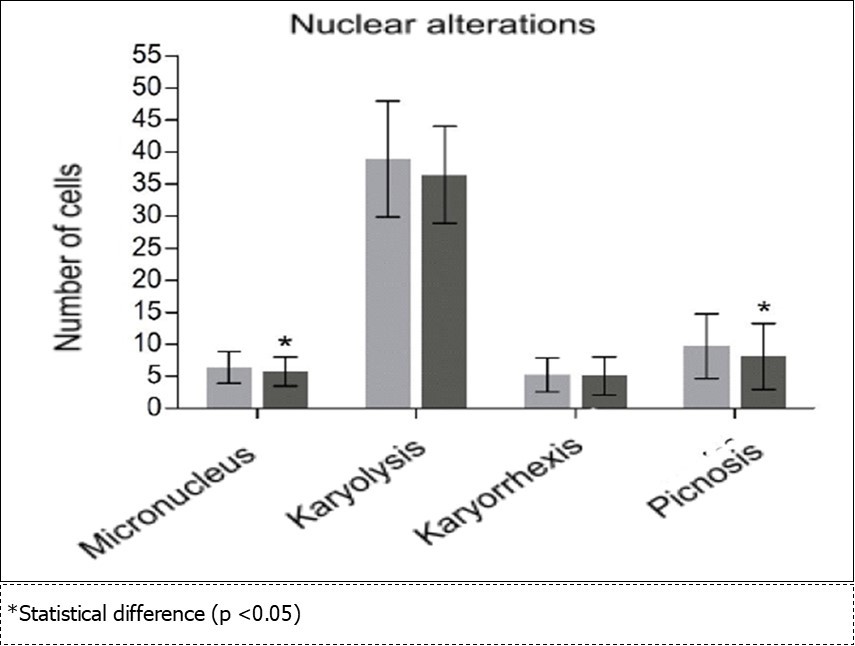
Discussion
In this study, we found that the consumption of grape juice, 400ml during thirty days, could significantly improve many parameters. Grape juice is an important source of polyphenols and the grape juice used in this study has a significant phenolic content (Table 1). The concentration of phenolic compounds in commercial grape juices shows great variation 270-3433 mg L-1, or 40 to 400 mg catechin/ml, and these differences may be due to the production techniques, analysis techniques and particular characteristics of each region3,42,43.
When we evaluate the isolated phenolic compounds, the highest concentration were Naringin (6.96 ± 0,21mg / L) and Epicatechin (5.38 ± 0,06mg / dl). The concentration of polyphenols differs between different types of juice. In our study, the catechin content differs from other studies that analyzed Brazilian grape juice4,44. However, we showed for the first time that Brazilian grape juice has an important content of naringin (Table 1).
Similarly to literature, we observed that the grape juice is an important trans-resveratrol source. Dani et al (2007) found a concentration of 0.21 mg L-1 in the variety “Bordo” of organic grape juice3. Another study outlined a maximum concentration of 1.10 mg L-1 trans-resveratrol44. The varying concentrations of trans-resveratrol may be attributed to many factors such as climate, grape variety, UV exposure and fungal infection, because the stilbene is produced as a defense mechanism45,46.
Several benefits are assigned to the consumption of products rich in polyphenols, especially those derived from grape, including, antioxidant, antimutagenic, cardioprotection, improved immunity and neuroprotection3,5,7,47,48,49. Accordingly, our results show a weight loss and a reduction in BMI and WC, just with the inclusion of grape juice in the diet. (Table 1).
BMI is used as a nutritional classifier by WHO that states the optimal values for the elderly being between 18.5 kg/m2 to 24.9 kg/m250. Several studies showed that the overweight and obese individuals present an increased risk of developing cardiovascular disorders and diabetes mellitus51,52,53. We found a significant reduction in BMI among older people, which can be kind of improvement in BMI in this population, with only grape juice inclusion in the diet. The reduction in WC may be associated with weight loss possibly in the abdominal region; the accumulation of fat in this region is a risk factor for developing cardiovascular diseases54.
Similarly , another study in young obese adults showed the grape juice consumption decreased WC with 12 weeks 56. This weight loss and reduction in WC may also be associated with thermogenic activity of polyphenols. Dulloo et al. (2000) reported the stimulation of thermogenic action, by the catechins, in an in vitro assay14. Studies with catechins and epicatechin showed that these compounds are able to inhibit adipocyte proliferation, induce apoptosis of mature adipocytes and hinder the absorption of ingested fat57,58. Inded, Sbarra et al. (2005) found that red wine extracts, rich in polyphenols, promoted inhibition of pancreatic lipase and thus suggest that there is a decreased secretion into the duodenum15.
Inhibition of pancreatic lipase by phenolic compounds or their reduction can be associated with the modulation of biochemical parameters in this study. Al-Ahmadi et al (2014) found modulation of cholesterol levels in animals with hypercholesterolemic diet and grape juice48Meanwhile, Zern et al. (2005) reported that the intake of polyphenols from grape, by women, had eneficial effects on plasma lipid, and thus reduced the risk of developing coronary disorders59. Stein et al. (1999) found that grape juice ingestion contributed to reduction in the oxidation of LDL in patients with this disorder60, as well as in normal individuals49,61.
Corroborating this, in the present study we found that some biochemical parameters reduced by chronic ingestion of grape juice, including total cholesterol and LDL cholesterol. The decrease in serum LDL cholesterol confirms a study, which used anthocyanidins supplementation in humans and they found a decrease in LDL cholesterol levels62.
In an in vitro study, the polyphenols presented in grapes neutralize the repression caused by the LDL cholesterol in the LDL receptor, thereby favoring the intracellular lipid homeostasis, causing a cholesterol63. In addition, the polyphenols could interfere on cholesterol absorption causing a decrease in hepatic cholesterol concentrations and therefore a reduction in LDL cholesterol59.
In our study, we did not verify a regulation of HDL cholesterol levels, different from that observed in other studies20,22,62. These authors observed an increase in the HDL cholesterol levels with the consumption of grape juice; however, the sample was composed of young adults and the time consumption was higher (60 days). The consumption for a longer period, has already been assigned as a relevant factor in modulating these parameters. In regards to this, Shanmuganayagam et al. (2007) demonstrated in hypercholesterolemic rabbits that lowered total cholesterol levels occurred only after 96 days of grape juice consumption21.
Chronic consumption of grape juice did not alter glucose levels (Figure 3e). This finding that sugars present in grape juice, if consumed at the standard dose and time according to this study did not offer risk to this parameter. Besides, some studies demonstrate the safety of the consumption of juices from fruit, compared to sweetened beverages and soft drinks, about the risk for developing diabetes mellitus II64,65. Similarly, Wang et al. (2014), in a meta-analysis demonstrated that different types of fruit juice, included grape , did not alter glucose and insulin levels66.
A study which was counducted in rats with hypercholesterolemic diet found glycemic control in those who consumed diet and grape juice, endorsing the findings in current study48. Contrary to our results, Gonçalves et al. (2011) found an improvement in glucose homeostasis in tri-athletes who consumed grape juice67, but the usage of athletes with high load stress, differ from the older sample used in this study which caused different results.
The results for the markers of renal function in current study showed a reduction in serum levels of urea after the grape juice consumption. The creatinine serum levels have not changed and serum urea remained within the recommended reference values (10-40 mg / dl). These results are similar to other study with pregnant rats and their offspring, in which grape juice consumption caused a reduction in the levels of urea in the offspring6.
The reduction in GGT levels is supported by Lee et al. (2004) that reported the consumption of fruit decreased in GGT levels68. Lee also found that alcohol and meat consumption requires a GGT proportional dose response,which rised the GGT level68. However, grape juice for coming from a fruit, being not alcoholic, might be responsible for a safe decrease in serum levels of GGT (Figure 5c).
No changes on the levels of liver enzymes ALT and AST, exhibite that chronic consumption of juice does not cause liver damage. The hepatoprotective action observed in grape juice consumption has been shown in other studies5,8,69. In a recent study in rats that consumed a high fat diet and grape juice had a significantly lower number of cells with steatosis, when they compared to the group that only consumed the high fat diet and water. This shows a liver protection in the experimental group that consumed grape juice, that possibly could be to the presence of phenolic compounds in the beverage8.
The improvement in performed TUG test, can be justified by two factors (Figure 2). The first could be relate to weight reduction. A study conducted with obese women submitted to a multiple intervention with resistance training, Tai Chi and diet observed that those undergoing intervention had a significant improvement in the performance of TUG and maintaining independence and a healthy lifestyle can reduce economic and personal burdens that are commonly associated with aging70,71. The second factor could be associated with cognitive improvement with the consumption of grape juice. Krikorian et al. (2012) found an improvement in the cognitive profile with grape juice consumption9. Rebelatto, Morelli and Borges (2007) address that improvements in cognition may cause recovering and the stability in the realization of multiple tasks becomes faster72.
The improvement in antioxidant activity can be measured by different parameters of the oxidative stress, can be modulated by diet32. In this study, we found that the intake of grape
juice 400ml chronically for thirty days promoted reduction in protein oxidation levels. This result is similar to the Burin et al. (2010), study where the consumption of 10 ml / kg / day grape juice promoted a 20% reduction in protein oxidation 15 adults. 42 Further, some studies in animals using extracts of vine leaves protein oxidation protection reported43,44,73. In animals, a study which was involved fat diet and grape juice consumption, found that those who consumed the juice decreased protein oxidation in cerebral cortex and cerebellum45.
In the present study we observed that the grape juice intake did not reduce the levels of lipid peroxidation, measured by TBARS method. Corroborating our results are the data presented by Bub et al. (2003) in animals which were into two group of exercise and without exercise the authors observed that the grape juice consumption did not change TBARS levels in the group which was not subjected to subject to the exercise, showing showing that levels of lipid peroxidation reduce only in the group subjected to exhaustive exercise47. The condition of stress or a factor seems to be related to increased capacity of the protective effect of grape juice in this parameter. However, Toaldo et al (2015) demonstrated that grape juice intake (single dose) reduced the levels of lipid peroxidation in human serum of healthy adults4. This can be explained by the profile of the sample used (youth / adult), suggesting that young people, aged 20-55 years are more likely to decrease lipid peroxidation through intervention than older people.
This study demonstrated a rise in plasma antioxidant potential after chronic consumption of grape juice, indicating that this drink is able to improve the antioxidant capacity of the elderly. This finding is the same with a double-blind study where the intake of drink rich in phenolic compounds are able to improve the plasma antioxidant activity49. This increase in antioxidant capacity may be related to an increase in the concentration of polyphenols in plasma, as evidenced by Gonçalves et al. (2011) where the use of grape juice for 20 days was able to increase the plasma concentration of these compounds67.
Grape juice consumption modulates enzymatic activity in several tissues and that this modulation is function of the phenolic content of the juice8. The activity of SOD significantly increased in our study, although the CAT activity remained stable, which generated a significant increase in relation SOD / CAT between the beginning and end of the study. Gonçalves et al. (2011) also found in triathletes an increase in SOD activity after the consumption of grape juice67. There are reports that the activity of SOD is very sensitive to the presence of phenolic compounds52,53, which may have happened in our study, since the antioxidant potential was high due to the presence of polyphenols, and this may have improved activity SOD.
Among the antioxidant defenses are thiols groups. These are defined as a class of organic sulfur derivatives characterized by the presence of sulfhydryl residues. In biological systems, these groups have different functions, including coordinating the proteins the immune system54. Most proteins have a free sulfhydryl residues which may be oxidised by free radicals55. Regarding the levels of sulfhydryl groups, we observed that the consumption of grape juice reduced the levels of this parameter. Different from that observed in studies with natural compounds (grape juice, propolis and soy protein) who observed an increase in the levels of grouping sulfhydryl after treatment in question56,57,74. The study by Lima and colleagues (2014) showed no difference between the sulfhydryl levels of pregnant rats treated with grape juice44. The decrease in sulfhydryl levels can be attributed to the fact that polyphenols have acted as an antioxidant defense, with no need of response activation in this group. Further, some studies in patients with Alzheimer's disease elicited that GSH system can be activated in response to oxidative stress, while not inducing the same not promote modulation of the58,59,60,61.
In our study we observed a reduction of nuclear changes, which may be related to cell protection offered by grape juice consumption. It is assumed that that the phenolics present compound in the beverage protects against attacks on double-stranded DNA, allowing a good process of mitosis and inducing a correct apoptotic process. Park et al. (2003) gave basis for this hypothesis to see that oxidative DNA damage decreased with the consumption of alcohol in young adults31. Moreover, Dani et al. (2009) a decrease in DNA damage in the group that consumed grape juice, in an animal model by COMET test7. There are studies that suggest that oxidative damage to DNA has an important relationship with chronic degenerative disorders, such as chronic renal failure, hypertension and acute myocardial infarction66,67,68.
Several pathways could be involved in the aging process. Between of these mechanisms, the Sirtuin-1 is one of the most studied including the resveratrol effect. According to the literature, proteomic profiles that include plasma Sirt 1 and protein analysis are critical to determine defects in the nuclear-mitochondria interaction relevant to the severity of cardiovascular disease, NAFLD, diabetes and neurodegenerative diseases.
Until the present moment there are no reports in the literature that relate, elderly, intervention and oxidative stress parameters, as well as damage to DNA searched. This pioneering study analyzes and verifies some improvement in oxidative stress profiles that may be related to decreasing frequency of cells with micronuclei or pictotic. Being able to complete so that consumption habits of grape juice in the elderly can be an alternative in promoting the health among this individual.
Conclusion
In conclusion, our study found that chronic consumption of grape juice for thirty days promotes weight loss and reduction of BMI and WC in the elderly. Similarly, it can modulate the levels of total cholesterol and LDL cholesterol while improving the performance on the TUG test. About the modulation of these variables in the elderly, grape juice makes a strong ally to health, because the modulated parameters in this study as weight and LDL-cholesterol are risk factors for developing cardiovascular diseases, and this may be related to increased antioxidant potential in plasma. The present study found that chronic consumption of grape juice, provides a protection against oxidative damage to proteins, increasing the antioxidant activity and the enzymatic activity of SOD, as well as the reason SOD / CAT. These results may encourage further studies, using grape juice for longer, in order to verify possible modulations of other biomedical parameters.
Acknowledgments
Instituto Brasileiro do Vinho (IBRAVIN); Coordenação de Aperfeiçoamento de Pessoal de Nível Superior (CAPES); Conselho Nacional de Desenvolvimento Científico e Tecnológico (CNPQ); Fundação de Amparo à Pesquisa do Estado do Rio Grande do Sul (FAPERGS); SUVALAN SUCO.
References
- 1.Instituto Brasileiro do Vinho (Ibravin).Research maps consumption habits of 100% grape juice. https://ibravin.org.br/Noticia/pesquisa-mapeia-habitos-de-consumo-do-suco-de-uva-100-/18
- 2.Kanner J, Frankel E, Granit R. (1994) Natural antioxidants in grapes and wines. , Journal of Agricultural and Food Chemistry 42(1), 64-69.
- 3.Dani C, Oliboni L S, Vanderlinde R. (2007) Phenolic content and antioxidant activities of white and purple juices manufactured with organically- or conventionally-produced grapes. Food Chem Toxicol. 45(12), 2574-80.
- 4.Toaldo I M, Cruz F A, TDL Alves.et al.(2015). Bioactive potential of Vitis labrusca L. grape juices from the Southern Region of Brazil: Phenolic and elemental composition and effect on lipid peroxidation in healthy subjects. Food Chemistry. 173, 527-535.
- 5.Dani C, MAB Pasquali, Oliveira M R. (2008) Protective effects of purple grape juice on carbon tetrachloride-induced oxidative stress in brains of adult Wistar rats. , Journal of Medicinal Food 11(1), 55-61.
- 6.Hilger D K, Wohlenberg M F, Schaffer T K. (2015) Purple Grape Juice, an Important Flavonoids Source, Influence in Biochemical Parameters in Offspring of Wistar Rats. Food and Nutrition Sciences. 06(07), 683-691.
- 7.Dani C, Oliboni L S, Umezu F M. (2009) Antioxidant and antigenotoxic activities of purple grape juice-organic and conventional-in adult rats. , Journal of Medicinal Food 12(5), 1111-1118.
- 8.Buchner I, Medeiros N, DDS Lacerda. (2014) Hepatoprotective and antioxidant potential of organic and conventional grape juices in rats fed a high-fat diet. , Antioxidants 3(2), 323-338.
- 9.Krikorian R, Boespflug E L, Fleck D E. (2012) Concord grape juice supplementation and neurocognitive function in human aging. , Journal of Agricultural and Food Chemistry 60(23), 5736-5742.
- 10.Cardozo M G, Medeiros N, Santos Dos, LDA. (2013) Effect of chronic treatment with conventional and organic purple grape juices (Vitis labrusca) on rats fed with high-fat diet. Cellular and Molecular Neurobiology. 33(8), 1123-1133.
- 11.Gabardo T, Peripolli C M, de Andra. (2015) Assessment of changes in energy metabolism parameters provoked by carbon tetrachloride in Wistar rats and the protective effect of white grape juice. Toxicology Reports. 2, 645-653.
- 12.Castilla P, Echarri R, Dávalos A. (2006) Concentrated red grape juice exerts antioxidant, hypolipidemic, and antiinflammatory effects in both hemodialysis patients and healthy subjects. , American Journal of Clinical Nutrition 84(1), 252-262.
- 13.Setorki M, Asgary S, Eidi A. (2010) Effects of acute verjuice consumption with a high-cholesterol diet on some biochemical risk factors of atherosclerosis in rabbits. , Medical Science Monitor 16(4), 124-130.
- 14.Dulloo A G, Seydoux J, Girardier L. (2000) Green tea and thermogenesis: Interactions between catechin-polyphenols, caffeine and sympathetic activity. , International Journal of Obesity 24(2), 252-258.
- 15.Sbarra V, Ristorcelli E, J Le Petit-Thévenin. (2005) In vitro polyphenol effects on activity, expression and secretion of pancreatic bile salt-dependent lipase. , Biochimica et Biophysica Acta - Molecular and Cell Biology of Lipids 1736(1), 67-76.
- 16.Hursel R, Viechtbauer W, Westerterp-Plantenga M S. (2009) The effects of green tea on weight loss and weight maintenance: A meta-analysis. , International Journal of Obesity 33(9), 956-61.
- 17.Wu C H, Lu F H, Chang C S. (2003) Relationship among habitual tea consumption, percent body fat, and body fat distribution. , Obesity Research 11(9), 1088-95.
- 18.Phung O J, Baker W L, Matthews L J. (2010) Effect of green tea catechins with or without caffeine on anthropometric measures: A systematic review and meta-analysis. , American Journal of Clinical Nutrition 91(1), 73-81.
- 19.LAE Hughes, ICW Arts, Ambergen T. (2008) Higher dietary flavone, flavonol, and catechin intakes are associated with less of an increase in BMI over time in women: A longitudinal analysis from the Netherlands Cohort Study. , American Journal of Clinical Nutrition 88(5), 1341-52.
- 20.Khadem-Ansari M H, Rasmi Y, Ramezani F. (2010) Effects of red grape juice consumption on high density lipoprotein-cholesterol, apolipoprotein AI, apolipoprotein B and homocysteine in healthy human volunteers. The open biochemistry journal. 4, 96-9.
- 21.Shanmuganayagam D, Warner T F, Krueger C G. (2007) Concord grape juice attenuates platelet aggregation, serum cholesterol and development of atheroma in hypercholesterolemic rabbits. 190(1), 135-142.
- 22.Zibaeenezhad M J, Mohammadi E, BMA Beigi. (2012) The effects of unripe grape juice on lipid profile improvement. , Cholesterol 2012, 1-3.
- 24.Anton S D, Manini T M, Milsom V A. (2011) Effects of a weight loss plus exercise program on physical function in overweight, older women: a randomized controlled trial. Clinical interventions in aging. 6, 141-9.
- 25.Chodzko-Zajko W J, Proctor D N, Fiatarone Singh MA. (2009) Exercise and physical activity for older adults. Medicine and Science in Sports and Exercise 41(7), 1510-1530.
- 26.Avila J J, Gutierres J A, Sheehy M E. (2010) Effect of moderate intensity resistance training during weight loss on body composition and physical performance in overweight older adults. , European Journal of Applied Physiology 109(3), 517-525.
- 27.Yuan L, Meng L, Ma W. (2011) Impact of apple and grape juice consumption on the antioxidant status in healthy subjects. , Int J Food Sci Nutr 62(8), 844-50.
- 28.Tudek B, Winczura A, Janik J. (2010) Involvement of oxidatively damaged DNA and repair in cancer development and aging. , Am J Transl Res 2(3), 254-284.
- 29.Zoecklein B, Fugelsang K C, Gump B, Nury F S. (1999) Wine Analysis and Production.New York:Chapman&Hall.
- 30.Singleton V L, Orthofer R, Lamuela-Raventós R M. (1999) Analysis of total phenols and other oxidation substrates and antioxidants by means of folin-ciocalteu reagent. Methods in Enzymology 299, 152-178.
- 31.Park Y K, Park E, Kim J S. (2003) Daily grape juice consumption reduces oxidative DNA damage and plasma free radical levels in healthy Koreans. Mutation research.529(1-2):. 77-86.
- 32.Podsiadlo D, Richardson S. (1991) The Timed “Up & Go”: A Test of Basic Functional Mobility for Frail Elderly Persons. , Journal of the American Geriatrics Society 39(2), 142-148.
- 33.Bischoff H A, Stähelin H B, Monsch A U. (2003) Identifying a cut-off point for normal mobility: A comparison of the timed “up and go” test in community-dwelling and institutionalised elderly women. Age and Ageing. 32(3), 315-320.
- 34.Barry E, Galvin R, Keogh C. (2014) Is the Timed Up and Go test a useful predictor of risk of falls in community dwelling older adults: A systematic review and meta- analysis. , BMC Geriatrics 14, 1-14.
- 35.Wills E D. (1966) Mechanisms of lipid peroxide formation in animal tissues. , The Biochemical journal 99(3), 667-676.
- 36.Levine R L, Garland D, Oliver C N. (1990) Determination of carbonyl content in oxidatively modified proteins. Methods Enzymol.186: 464-478.
- 37.Aksenov M Y, Markesbery W R. (2001) Change in thiol content and expression of glutathione redox system gene in the hippocampus and cerebellum in Alzheimer’s disease. , Neurosci Lett 302(2), 141-145.
- 38.Bannister J V, Calabrese L. (1987) Assays for superoxide dismutase. , Methods Biochem Anal 32, 279-312.
- 40.Benzie I F, Strain J J. (1996) The ferric reducing ability of plasma (FRAP) as a measure of "antioxidant power": the FRAP assay. , Anal Biochem 239(1), 70-6.
- 41.Pulido R, Bravo L, Saura-Calixto F. (2000) Antioxidant activity of dietary polyphenols as determined by a modified ferric reducing/antioxidant power assay. , Journal of Agriculture and Food Chemistry 48(8), 3396-3402.
- 42.Burin V M, Falcão L D, Gonzaga L V. (2010) Colour, phenolic content and antioxidant activity of grape juice. Food Science and Technology 30(4), 1027-1032.
- 43.Sautter C K, Denardin S, Alves A O. (2005) Determination of resveratrol in grape juice produced in Brazil. Food Science and Technology 25(3), 437-442.
- 44.MDS Lima, IDSV Silani, Toaldo I M. (2014) Phenolic compounds, organic acids and antioxidant activity of grape juices produced from new Brazilian varieties planted in the Northeast Region of Brazil. Food Chemistry. 161, 94-103.
- 45.Ali F, Ismail A, Kersten S. (2014) Molecular mechanisms underlying the potential antiobesity-related diseases effect of cocoa polyphenols. , Molecular Nutrition and Food Research 58(1), 33-48.
- 46.APS Lucena, RJB Nascimento, JAC Maciel. (2010) Antioxidant activity and phenolics content of selected Brazilian wines. , Journal of Food Composition and Analysis 23(1), 30-36.
- 47.Bub A, Watzl B, Blockhaus M. (2003) Fruit juice consumption modulates antioxidative status, immune status and DNA damage. , The Journal of nutritional biochemistry 14(2), 90-8.
- 48.Al-Ahmadi A A, Ali S S, Ayuob N N. (2014) Amelioration of hypercholesterolemiainduced hepatic changes with red grape juice: A histopathological study. Histology and Histopathology 29(9), 1169-1183.
- 49.Miglio C, Peluso I, Raguzzini A. (2014) Fruit juice drinks prevent endogenous antioxidant response to high-fat meal ingestion. , British Journal of Nutrition 111(2), 294-300.
- 51.Burton B T, Foster W R, Hirsch J. (1985) . Health implications of obesity: an NIH Consensus Development Conference. International journal of obesity 9(3), 155-70.
- 52.Deuremberg P, Kooy K Van der, Hulshof T. (1989) Body mass index as a measure of body fatness in the elderly. European journal of clinical nutrition. 43(4), 231-6.
- 53.Higgins M, Kannel W, Garrison R. (1987) . Hazards of Obesity the Framingham Experience. Acta Medica Scandinavica 222(723), 23-36.
- 54.Pouliot M C, Després J P, Lemieux S. (1994) Waist circumference and abdominal sagittal diameter: Best simple anthropometric indexes of abdominal visceral adipose tissue accumulation and related cardiovascular risk in men and women. , The American Journal of Cardiology 73(7), 460-468.
- 55.Baek S H, Chung H J, Lee H K. (2015) Treatment of obesity with the resveratrol-enriched rice DJ-526. Scientific Reports.4(1):. 1-6.
- 56.Hollis J H, Houchins J A, Blumberg J B. (2009) Effects of concord grape juice on appetite, diet, body weight, lipid profile, and antioxidant status of adults. , Journal of the American College of Nutrition 28(5), 574-582.
- 57.Lin J, Della-Fera M A, Baile C A. (2005) Green tea polyphenol epigallocatechin gallate inhibits adipogenesis and induces apoptosis in 3T3-L1 adipocytes. , Obesity Research 13(6), 982-990.
- 58.Hursel R, Westerterp-Plantenga M S. (2013) Catechin- And caffeine-Rich teas for control of body weight in humans. , American Journal of Clinical Nutrition 98(6), 1682-1693.
- 59.Zern T L, Wood R J, Greene C. (2005) Grape Polyphenols Exert a Cardioprotective Effect in Pre- and Postmenopausal Women by Lowering Plasma Lipids and Reducing Oxidative Stress. , The Journal of Nutrition 135(8), 1911-1917.
- 60.Stein J H, Keevil J G, Wiebe D A.et al.(1999). Purple grape juice improves endothelial function and reduces the susceptibility of LDL cholesterol to oxidation in patients with coronary artery disease. , Circulation 100(10), 1050-1055.
- 61.Coimbra S R, Lage S H, Brandizzi L. (2005) The action of red wine and purple grape juice on vascular reactivity is independent of plasma lipids in hypercholesterolemic patients. , Brazilian Journal of Medical and Biological Research 38(9), 1339-1347.
- 62.Qin Y, Xia M, Ma J. (2009) Anthocyanin supplementation improves serum LDL- and HDL-cholesterol concentrations associated with the inhibition of cholesteryl ester transfer protein in dyslipidemic subjects. , American Journal of Clinical Nutrition 90(3), 485-492.
- 63.Dávalos A, Fernández-Hernando C, Cerrato F. (2006) Red Grape Juice Polyphenols Alter Cholesterol Homeostasis and Increase LDL-Receptor Activity in Human Cells In. Vitro1,2. The Journal of Nutrition 136(7), 1766-1773.
- 64.Eshak E S, Iso H, Mizoue T. (2013) Soft drink, 100% fruit juice, and vegetable juice intakes and risk of diabetes mellitus. , Clinical Nutrition 32(2), 300-308.
- 65.Romaguera D, Norat T, Wark P A. (2013) Consumption of sweet beverages and type 2 diabetes incidence in European adults: Results from EPIC-InterAct. , Diabetologia 56(7), 1520-1530.
- 66.Wang B, Liu K, Mi M. (2014) Effect of fruit juice on glucose control and insulin sensitivity in adults: A meta-analysis of 12 randomized controlled trials. , PLoS ONE 9(4), 1-10.
- 67.Gonçalves M C, Bezerra F F, EC de Araujo Eleutherio. (2011) Organic grape juice intake improves functional capillary density and postocclusive reactive hyperemia in triathletes. , Clinics 66(9), 1537-1541.
- 68.Lee D H, Steffen L M, Jacobs D R. (2004) Association between serum γ-glutamyltransferase and dietary factors: The Coronary Artery Risk Development in Young Adults (CARDIA) Study. , American Journal of Clinical Nutrition 79(4), 600-605.
- 69.Rodrigues A D, Scheffel T B, Scola G. (2013) Purple grape juices prevent pentylenetetrazol-induced oxidative damage in the liver and serum of Wistar rats. , Nutrition Research 33(2), 120-125.
- 70.Maris S A, Quintanilla D, Taetzsch A. (2014) The combined effects of Tai Chi, resistance training, and diet on physical function and body composition in obese older women. , Journal of Aging Research 1-8.
- 71.Rikli R E, Jones C J. (2013) Development and validation of criterion-referenced clinically relevant fitness standards for maintaining physical independence in later years. , Gerontologist 53(2), 255-267.
- 72.Rebelatto J R, JGS Morelli, Borges C F. (2007) Quedas: fatores determinantes, consequências e intervenções profissionais, In: Rebelatto JR,Morelli JGS,Borges CF,Fisioterapia Geriatrica: A Prática da Assistência ao Idoso. São Paulo: Manole. 167-188.
- 73.Malacrida C R, da Motta S. (2005) Total phenolics and anthocyanins in grape juice. Food Science and Technology 25(4), 659-664.