Global importance of supporting the krill to whale component of the pelagic food web associated with migrations following deep sea seamounts
Abstract
The main diet of baleen whales is krill in the Arctic, Antarctic and during migrations in the Atlantic, Pacific and Indian Oceans. Hence, the aim of this paper is to quantify the global importance of the krill to baleen whale component of the pelagic food web and possible feedback loops. That was undertaken by comparing the results of Ecopath Models in the Antarctic and Arctic Oceans and to migration areas in the North Atlantic and Alaska, was well as the large Seamount area from the Antarctic and Arctic. Biological production transfer is the essential component of the prey to predator pelagic food web, which maintains the production of predators. The importance of sustaining global baleen whale migrations is to support ecosystem production by whale defecation contribution to nutrient recycling. It is important to sustain krill and fish abundance in whale migration feeding areas using ecosystem-based fishery management (EBFM) fishing rates. It was shown by the literature that migrations tended to followed deep-sea seamounts, and baleen whale defecation and nutrient cycling at seamounts led to the effects of nutrient upwelling by deep sea currents at seamounts. Hence, it is suggested seamounts be protected as important marine ecosystems. Therefore, those processes indicate sustaining krill and whale abundance is likely to support global marine ecosystem stability in open ocean migration areas.
Author Contributions
Academic Editor: Anubha Bajaj, Consultant Histopathologist, A.B. Diagnostics, Delhi, India
Checked for plagiarism: Yes
Review by: Single-blind
Copyright © 2025 Bruce R. Hodgson
 This is an open-access article distributed under the terms of the Creative Commons Attribution License, which permits unrestricted use, distribution, and reproduction in any medium, provided the original author and source are credited.
Competing interests
The authors have declared that no competing interests exist.
Citation:
Introduction
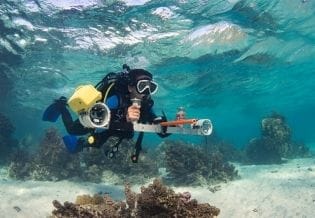
This study aims at defining the importance of supporting the krill to whale component of the pelagic food web. In this context, a food web is the feeding relationships for pelagic, open sea, species moving up in trophic levels (TL) from phytoplankton in TL1 to krill, a large zooplankton, in TL2, to small pelagic fish such as sardines in TL3 and to predators TL4. In the study here, baleen whales feed on krill and fish, giving a TL less than 4.0. Note that predators consume a variety of prey species in each TL and may feed sometimes other levels such as the baleen whales. Importantly, baleen whales have no teeth but filter their prey by rows of long protein based fringed plates. Hence, this study relates to the potential global scale sustainability of open ocean production by release of nutrients by baleen whale consumption of krill and other prey via defecation. The trophic transfer of krill biological production to baleen whales provides an important understanding of the pelagic food web, which can be estimated from information in Ecopath models 1. They are an ecological model showing differences in biomass and production of species in a pelagic food web, including the amount of prey consumed by predators in the ecosystem. Trophic transfers were estimated from information in Ecopath models used in polar areas where baleen whales feed and during winter migrations to temperate areas. That global process aligns with the objectives of the UN Decade of Ocean Science for Sustainable Development 2. Hence, this study undertakes an initial global trophic dynamics study of food flow, with related nutrient enrichment, and ecological production driven by baleen whale migrations. The study is supported by the recent understanding of worldwide baleen whale migration pathways and maps of deep-water ridges which indicate baleen whales tend to follow ridge related seamounts with potential nutrient enrichment of surface waters by deep-water ocean currents 3. Seamounts are submarine mountains that support deep-sea ecosystems but don’t reach the water surface.
In the Antarctic Ocean, krill (Euphausia superba) has been shown as an important component of the zooplankton production and is a major food source for baleen whales, particularly the Humpback Whale (Megaptera novaeangliae), 4, however krill consumption was estimated the most by Antarctic penguins by 5. Furthermore, baleen whale consumption of krill in the Antarctic leads to nutrient recycling from fecal material and increased phytoplankton production, PP, see 6, 7 and 8. That suggests baleen whale consumption of krill in the Antarctic Ocean may contribute to nutrient input of the circumpolar circulation promoting high Southern Ocean phytoplankton production 9, as well as supporting Krill production with feedback to whale abundance. For further information on baleen whale contribution to ecosystem production, see for example the literature by 10 and 11, as well as the food web structure of krill abundance in the Arctic 12 and the Antarctic by 13.
krill to baleen whale food web transfer
Surprisingly, there is limited literature on the global importance of supporting the krill to baleen whale food web transfer, but 14 mention benthos, the animals that live on, in, or near the bottom of a sea, is related to phytoplankton production in the Arctic Ocean food web and phytoplankton supports production of zooplankton and krill, pelagic fish and baleen whales. However, the role of baleen whale feeding on trophic transfer from phytoplankton, to zooplankton and krill, fish and ultimately baleen whales in open ocean areas is not well known. For example, 15 found baleen whales in the Barents Sea were mostly associated with the presence of krill, and to a lesser extent with capelin, amphipods and polar cod, but they had no information on transfer of krill consumption to whales. Hence, to address the global krill to whale food web, the novel approach of using published Ecopath Model data was used to describe the krill to whale trophic transfers.
Global importance of baleen whale consumption of krill for nutrient recycling
The literature indicates nutrient recycling process by whale consumption of krill and fish could occur globally. In terms of global processes, 16 studied the global importance of nutrient recycling for ecosystem production and 17 found nutrient cycling was associated with cetaceans, marine mammals including whales, dolphins, and porpoises, consumption of fish, rather than krill. The study by 18 sampling the Gulf of Maine was dominated by baleen whales and the whales sustained production where they occurred in high densities. Most of the nitrogen released by defecation was as ammonia in the shallower portion of their depth range. The recycled nutrients were expected to increase local phytoplankton production, leading to increased zooplankton, Euphausiids, and small pelagic fish consumed by the whales. That was upheld by 19 who found whales can influence food web biogeochemical cycles by moving nitrogen and iron to surface waters. Furthermore, 20 suggested implementation of global processes to maintain whale numbers could increase nutrient recycling and release fisheries from the effects of overfishing. The study by 21 found pre-whaling populations may have supported productivity in global large marine regions through enhanced nutrient recycling of iron and in regions limited by nitrogen or phosphorous. That was also noted by 22 who suggested the whale numbers could have increased production of marine ecosystems and the current population removing significant levels of carbon from the atmosphere. The literature also indicates increased water column nutrients by consumption of fish during migrations 17. They noted whale defecation in the normally nutrient limited world’s deep-water oceans is likely to increase the production of surface waters via upwelling processes, and likely due to returning to surface water to breathe where defecation introduces nutrients. Hence, this paper describes the global importance of quantifying the krill to whale component of the pelagic food web.
Coastal nutrient upwelling and baleen whale migrations
The global baleen whale migrations are known to occur along productive continental western coastal areas due to upwelling of nutrients on their way to breeding grounds (See migration maps in 23 and description of whale migrations in 24. Upwelling is an oceanographic process involving movement of dense, cooler, and mostly nutrient-rich water from deep water towards the ocean surface, replacing the warmer nutrient-depleted surface waters. Due to the prevalence of upwelling of nutrients to surface water production 25 it is not surprising that whale migrations tend to occur along the west coast of continents. The migration map in 26 shows baleen whale migrations from the Bering Sea Arctic along the west coast of North America to Mexico, including out to Hawaii by humpback whales, and blue whales migrating further south to Costa Rica. In addition, blue whales, including humpback whales, are shown to migrate up the west coast of South America to southern Ecuador 27, which are likely originating from the Southern Ocean via the Antarctic Peninsula. The benefit of upwelling to whales is also supported by 28 who showed high Euphausiid densities of Thysanoessa spinifera and Euphausia pacifica are supported by high primary production on the west coast of North America in Monterey Bay, California and potentially by blue whale feeding on the krill.
In the southern hemisphere, migration was noted In Western Australia and the east coast of Australia and islands of the South Pacific (Oceania). A source of whales at islands of the South Pacific was indicated in the Ecopath Model of Bali Strait, Indonesia by 29. They noted whales migrate from the Indian Ocean to Pacific Ocean via passages between Indonesian Islands. Although they only noted Minke Whales (Balaenoptera acutorostrata and Sperm Whales (Physeter catodon) at Bali, it is likely they came from the Antarctic via Western Australia 30, likely along the archipelagos and range of islands at Ashmore, Cartier, Timor and Suva to Indonesia. However, 24, see their Table 2, reported Blue whales from Antarctica migrate to the west coast of Australia in the eastern Indian Ocean and then north into the Banda Sea, around Timor, Indonesia. They also noted Humpback and baleen whale breeding stocks off Western and Eastern Australia, southern right whales off south-central and southwestern Australia. Furthermore, the map by 26 also shows migrations in the southern Atlantic Ocean occurred in productive coastal areas of Brazil and southwestern Africa. In the Indian Ocean, migrations were noted south of the Horn of Africa in the Somali Sea, south-eastern Africa and Madagascar, and in the Pacific Ocean. In addition, they showed breeding and calving during summer and winter areas along continental western South America to the Corcovado Gulf in Chile. Those supplement the location of global humpback whale breeding and calving areas by 23. In addition, whale migrations from the Arctic to the Caribbean islands are shown by 31 and to the Azores Islands on west coast of South America by 32 in their Ecopath Model. Although the model does not show results for local krill species, it found the baleen whales consume 13.6% fish in their diet. The study by 33 reported whale migration from Antarctica to Tanzania, eastern Africa on the coast of the Indian Ocean for breeding,
Ecopath models for biological production transfer from krill to predators
Seven Ecopath Models were found that include the Arctic and Antarctic Ocean areas, and in migration areas in the Atlantic, Pacific and Indian Oceans. The associated feedback loops of baleen whale consumption of krill production with increased phytoplankton and benthos production due to nutrient recycling were investigated. Note that a feedback loop is a process of maintaining ecosystem stability, due to the output of a process influencing the input. Benthos production was included because detritus produced by whale defecation likely increases benthos production as 34 showed benthos surface feeders consume detritus. As the published global whale migration paths also showed baleen whales tend to migrate in productive coastal areas due to upwelling, the Ecopath Model for the Northern California Current by 56 was also included to investigate the relative contribution of baleen whales to coastal production.
An additional factor was that 35 suggested the amount of krill consumed by baleen whales could be reduced by consumption by other predators such as penguins. Hence, the amount of krill production consumed by other main predators was estimated using the Diet Matrix shown in the Ecopath models, which defines the proportion of each prey in the diet of every predator in the ecosystem. As trophic transfers of prey consumption to predators involve the consumption of prey biological production rather than biomass 1, the trophic transfer method developed by 36 was used to estimate biological production transfer from krill to baleen whales as well as for other predators. Hence, it is suggested the application of various Ecopath Models across key oceanic systems and the integration of ecosystembased fishery management (EBFM) principles quantifies the influence of krill-whale interactions on nutrient recycling, phytoplankton regeneration, and benthic productivity. Importantly, the EBFM for managing fisheries maintains the marine ecosystem stability by supporting the role of predators and interactions between species in trophic levels. Accordingly, the literature was used to develop new knowledge and insights for the aim of understanding the global importance of baleen whale consumption of krill and associated sustainability of ecosystem production by feedback loops. The large marine ecosystem theory discussed by 37 was the beginning for investigating potential feedback loops. However it should be understood that 38 showed an increase in phytoplankton production in the Arctic Ocean was not due to whales but may have been due to increased new or recycled nutrients by climate change effects of reduced sea ice cover.
Methods
Krill production and baleen whale consumption as well as the related phytoplankton and benthos production were estimated using the following Ecopath Models. Ecopath Model results for the Southern Ocean krill fishery area are in the supplementary file S1 in 39, and for the Antarctic Peninsula by 40, as well as during migrations from the Antarctic Peninsula to South Georgia Island, east of Cape Horn by 41. Significant migrations also occur from the Antarctic to seamounts at the Campbell Plateau, east of New Zealand, so the Ecopath Model for Chatham Rise by 42 is also included. Ecopath models were also used for the Arctic Ocean and migrations into the north Atlantic and Pacific Ocean. The most recent Ecopath Model data for the Norwegian Sea and Barents Sea in the Arctic Ocean by 43 was used that includes biomass and P/B ratios for krill which are consistent with the finding by 15 that baleen whales aggregate in areas of high krill abundance. Note that the study by 44 was not used due to having a low krill production about 23% of that in 43. However, the Ecopath Model at Iceland for baleen whale migrations from the Arctic Ocean, just outside the Arctic Circle, by 45 was used. That whale migrations continue into the northern Atlantic Ocean 26, their Figure 4.1. As baleen whales also tend to migrate in nutrient enriched upwelling areas along western continental shelves, the Ecopath Model for Alaska’s Prince William Sound was included 46. The Alaska Sound area is the path for baleen whales to migrate from the Arctic Ocean via the Bering Strait to the nutrient rich upwelling area of the Northern California Current (see Figure 9 in 23.
As the study of global importance for the whale to krill food web needs to be based on using consistent results for the Ecopath Models, the Ecopath Model for the California Current ecosystem by 47, see their Table 1) gives the coefficient of variation, CV, defined as standard deviation divided by the mean. In statistics, the standard deviation is the amount of variation of values about its mean. The biomass Humpback and grey whales CV was 0.15, Fin 0.18 and for the less abundant blue 0.24 and Minke 0.30. Although the biomass for phytoplankton, benthos and krill (Euphausiids) was not known, the P/B CVs were 0.1, 0.2 and 0.2, respectively. The CVs for phytoplankton and benthos were assumed to be similar for the P/B and krill biomass assumed 0.25 using values for fish. Those CV values represent the uncertainty of the Ecopath model values used here and give an acceptable level of uncertainty in the Ecopath Model results obtained.
The criteria for using Ecopath Models were: the biomass and biological production to biomass ratio, P/B ratio, are shown for phytoplankton, krill and benthos, as well as the baleen whale biomass for the species in the ocean area studied. In this context, biological production is the rate at which the biomass of marine phytoplankton and animals is produced in an ecosystem per year. To allow estimation of krill production consumption by whales and other dominant predators via the food web, the Ecopath Models used also needed to show the trophic level of the predators and the amount of krill in their diet. The Ecopath Model Diet Matrix of predators consuming prey species shows benthic animals consume some detritus non-living particulate organic matter of dead plants and anumals and fecal animal waste, so the whale biomass was compared with the benthos production, as well as the phytoplankton production in the ocean areas. Note that detritus by itself was not used to assess the effects of whale defection because 48 showed detritus could be present as dead carcasses, dissolved organic matter or particulate organic matter, while most Ecopath Models only show the total detritus. Using the krill diet from the Diet Matrix, the method by 36 was used to estimate krill production consumed by baleen whales. The method shows how to estimate the Trophic Transfer Efficiency, TTE, of prey biological production to predators using TTE’s estimated from the biological production in the Ecopath Models. Here, the TTE is the amount of prey biomass biological production passed from a lower trophic level to the next higher level in an ecosystem. The method is based on fundamentals of the prey biological production TTE to the dominant predator production originally derived by 49 of about 10%, after losses to respiration and to detritus. Note that the method of 36 to quantify trophic transfer efficiencies estimates the consumptionof prey biomass biological production by the predator, not the prey biomass obtained by B x (Q/B) using the Q/B, where Q is the biomass consumption in the ratio of Ecopath Models.
Baleen whale consumption of krill
The Ecopath Model by 39 for the Antarctic Ocean Krill (Euphausia superba) fishery area of 3.7 million Km2 was used to estimate the krill to baleen whale TTE and krill consumption. The average transfer efficiency from prey production to predator production for a given trophic level ranging from TL 1 phytoplankton to TL5 upper predators was estimated by Equation 6 from 36 by:
TTE = 0.54 x TLpred-1.26 (1).
In this situation, TLpred is the trophic level of the predator, in this case baleen whales are the main predator in the Ecopath Model with krill as the dominant prey. Additionally, the biological production transfer is the essential component of the prey to predator pelagic food web, which 36 showed maintains the production of predators for ecosystem stability.
To estimate the biological production consumption of prey by a predator it is necessary to know the biological production, P, of the prey, shown by 1 from Ecopath Model results by multiplying biomass, B, by the production to biomass ratio, P/B, giving P = B x (P/B). From ecosystem food web principles, 36, see their reported Equation 4, estimated the consumption of prey biological production by a predator, Qpred, was related to the prey biological production, Pprey, and the TTE by:
Qpred = Pprey x √(TTE) (2).
The prey biological production consumption, Qpred, in equation 2 is modified by applying the proportion of krill in the predator diet from the Diet Matrix in the seven Ecopath Models to the prey biological production, Pprey. Hence, the prey biological production is adjusted in equation 3 by:
Qpred = Pprey x √(TTE) x DietPred (3).
Note that Qpred is not the total consumption of prey production by a predator because most of the food consumed, other than the approximate 10% food web transfer, is lost due to respiration and to detritus, as explained in the Ecopath Model by 1. The production transfer does not include losses, as Qpred is the krill prey production consumed by baleen whales, in this case, during summer. Also, during migrations the literature indicates baleen whales consume a mix of krill and fish species, which was recorded at the Chatham Rise Diet Matrix, so the total consumption by whales was estimated using krill and fish diets. As the krill species vary in migration areas, the Ecopath Model takes the various biomass and P/B ratios into account for estimation of biological production.
As the number of suitable Ecopath Models was limited to seven, a comparison is shown below for possible further research on the global importance of baleen whales contributing to nutrient recycling.
Results
The krill Euphausia superba consumption by baleen whales in the Antarctic Ocean was compared with that for the combined Arctic Ocean krill species Meganyctiphanes norvegica, Thysanoessa inermis and T. longicaudata, while at Chatham Rise, New Zealand in the Southwest Pacific Ocean, the krill species Euphausia superba was stated as the main food item, including the krill Thysanoessamacrura.
Consumption of krill by baleen whales and associated phytoplankton and benthos production
The seven Ecopath Model results are shown in Table 1 and Figure 1, below. Krill biological production and consumption by baleen whales was estimated using equation 3 and the biological characteristics for each ocean area are shown in Table 1 and the footnotes.
Table 1. Ecopath Model results for the Antarctic Ocean and Arctic Ocean and during migrations to South Georgia Island, Chatham Rise, New Zealand, Iceland, and Prince William Sound, Alaska, with possible relationship with phytoplankton and benthos production. Units: biomass tww/Km2, P/B (/year), production and krill consumption by baleen whales tww/Km2/year. Estimated whale biomass and benthos production are in square brackets.| Ocean Area | Reported Baleen WhaleTL | AverageTTE | KrillProduction | Krill productionConsumption by Baleen Whalesf | Baleen WhaleBiomass | PhytoplanktonProduction | Benthos Production | DetrituseB |
| Antarctic Oceana | 3.54 | 0.110 | 62.5 | 16.58 (26.5%) | 2.16 | 9000 | 450 | 80.0 |
| Antarctic Peninsulab | 4.01 | 0.0938 | 161.9 | 11.9 (7.4%) | 1.26 | 5174 | 288 | - |
| South Georgia Islandc | 3.71 | 0.1035 | 79.2 | 20.38 (25.7%) | 0.03 | 1560 | 38.9 | - |
| Chatham Rise, NZd | 3.6 | 0.1075 | 49.1 | 10.8 (22.0%) | 0.005 | 2761 | 48.4 | - |
| Norwegian and Barents Sea, Arctic Oceane | 3.90 | 0.097 | 117.5 | 15.37 (13.1%) | 0.134 | 1766 | 99 | 25 |
| Iceland Watersf | 3.333 | 0.1185 | 98.8 | 17.68 (17.9%) | 0.19 | 1429 | 57.3 | 20.5 |
| Prince William Sound, Alaskag | 3.7 | 0.1039 | 69.7 | 11.17 (16.0%) | 0.158 | 2028 | 90.0 | 114.48 |
The Ecopath Models gave consistent results for biological characteristics in all the areas except baleen whale biomass and benthos production at the Antarctic Peninsula, which were low relative to the high phytoplankton and krill production in 40. Their low benthos production was by sampling in offshore areas with low biomass, which could be an order of magnitude lower than in nearshore areas, as shown by 46 in Prince William Sound, Alaska. For that reason, baleen whale biomass was estimated from detailed studies for whale biomass by 50 and for benthos production by 52 in the Antarctic Peninsula. The average baleen whale biomass was estimated as 1.26 t/Km2 using the lowest values in 50, see their Table 2 and Figure 5). They showed the Antarctic Peninsula is an area of active whale migration, and 51 noted baleen whales only feed on krill for about three to 4 months in the Ross Sea and then migrate to warmer waters, so it appears the Ecopath Model whale biomass, an order of magnitude lower at 0.17 t/Km2 by 40 was based on a period low whale numbers.
The study by 52, see their Table 4 and Figures 3 and 6 for Antarctic Peninsula benthos production was mostly in bays and inlets along the peninsula and the species consuming organic matter were on soft sediments in <20m depth. They estimated the soft sediment benthos standing stock as 391 tC/km2, but Figure 3 shows the measured biomass at the two sampling sites in ash free dry weight (AFDW) g/m2, indicating the units are 391 KgC/km2. To make the units consistent with tww/Km2 used for biomass in Ecopath Models, The study by 54 showed the conversion factor from AFDW to wet weight typically requires multiplying by 11%, slightly higher than the 10% used by 42 for gC converted to wet weight. That adjustment gave a biomass about 4.3 tww/Km2. In addition, 52 showed the two sampling sites represented about 12% of the soft sediment sites in their Figure 6, so the Antarctic Peninsula biomass was estimated by multiplying 4.3 tww/Km2 by 12, giving a total biomass of 51.6 tww/Km2. To estimate the benthos production, the average P/B for benthos of 5.58 in the Cornejo-Ecopath Model by 40 was used, giving 288 tww/km2/year.
The findings in Table 1 show some important differences between ocean areas. The Antarctic Ocean had the highest baleen whale biomass and estimated krill consumption, phytoplankton and benthos production, but the second lowest krill production, likely due to high consumption by whales and other predators such as penguins. The high benthos production in the Antarctic was likely due to the high whale consumption of krill with defecation to detritus. The lowest of proportion of krill consumption of 7.4% was in the Antarctic Peninsula, similar to the 4–6% of the krill biomass by 53, but the krill biomass in the Peninsula area by 54 was unknown. The highest krill production was at the Antarctic Peninsula, due to the low baleen whale diet of only 24% compared with 80% in the Diet Matrix for Antarctic Ocean. The reason for low Peninsula krill consumption appears due to competition with high krill consumption by Antarctic lantern fish, small and medium pelagic fish and the whales consuming an estimated 27% of Antarctic lantern fish, small pelagic fish and 12% cephalopods rather than krill. The finding is consistent with the Peninsula being an active migration area, so it appears whales don’t spend much time feeding on krill and aim for larger prey. The Antarctic Peninsula high phytoplankton and benthos production, with moderately high baleen whale biomass supported the importance of whale biomass defecation on ecosystem production. In contrast, the low baleen whale biomass at South Georgia Island was possibly due to as an important migration path, suggesting the whales pass through rather than stay to feed, possibly because krill fishing is allowed in the area. In relation to whale migrations, large populations of Humpback whales are shown migrating from the Antarctic to the Chatham Rise seamount area east of New Zealand by 26. The Ecopath Model at Chatham Rise by 42 shows the low krill production was supplemented by consuming fish and possibly benthos at the seamounts. The Diet Matrix shows baleen whales consume 16% of mesopelagic fish (Lantern fish and other small midwater fish) in their diet, which indicates the importance of sustaining fish abundance in whale migration feeding areas.
Comparison of the Arctic Ocean with the Antarctic shows the Arctic Ocean has a higher krill production than in the Antarctic, probably due to lower consumption by the low baleen whale biomass and lower whale krill diet of 42%. The 15% higher krill production at Iceland is supported by the higher baleen whale migration from the Arctic Ocean to seamounts forming Iceland shelf waters 26. Surprisingly, the continued migration into the Pacific Ocean at Alaska showed only a 15% higher phytoplankton production and benthos and similar benthos production to that in the Arctic, but a 40% lower krill production than at Iceland. The Alaskan Diet Matrix showed krill was heavily preyed by carnivorous zooplankton, large jellyfish, cephalopods, squid, octopus, cuttlefish, or nautilus, forage fish, also called bait fish, small pelagic fish that feed on zooplankton, mesopelagic fish, in the middle layer of the ocean, Pacific Sardines and Mackerel, which probably explains the lower krill production. The potential contribution to production of the similar baleen whale biomass at Alaska to that at the Arctic and Iceland was investigated by including Alaska in the statistical comparison of phytoplankton and benthos production with whale biomass, below.
Relationship of baleen whales with ecosystem production feedback loops
The above results for feedback loops for phytoplankton and benthos production show the highest levels in the Antarctic Ocean with the highest baleen whale biomass. The relationships shown in Figure 1 provide a preliminary indication of the global importance of baleen whale biomass on increased ecosystem production via defecation and nutrient recycling.
Figure 1.Relationship between baleen whale biomass with phytoplankton and benthos production in the Arctic and Antarctic Oceans and during migrations for potential relation to feedback loop of whale consumption and defecation promoting ecosystem production. The benthos production is included because it is a major consumption of accumulated detritus with likely nutrient recycling into the water column, which then promotes phytoplankton production.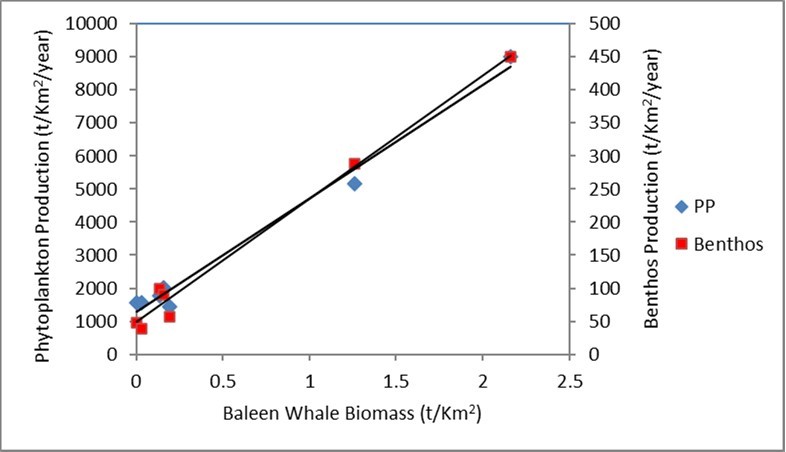
PP (tww/Km2/y) = 3441.4 x Whale Biomass (tww/Km2) + 1282.1(4).
R² = 0.9863, n = 7, p<0.001.
Benthos Production (tww/Km2/y) = 187.42 x Whale Biomass (tww/Km2) + 47.682(5).
R² = 0.988, n = 7, p<0.001.
The baleen whale biomass contribution to phytoplankton and benthos production at Alaska was estimated using the above equations and gave phytoplankton production as 1862 ± 186 tww/Km2/year, about 90% of the Ecopath Model, and benthos production 77 ± 8.5 tww/Km2/year, 86%. Errors are from the overall CV error for the seven regressions in Figure 1 for phytoplankton production, which gave average 0.10, maximum 0.35 and minimum 0.01, and the seven benthos production averaged 0.11, maximum 0.45 and minimum 0.07. The comparisons show baleen whales made a significant contribution to the Alaskan coastal production, probably by their influence on nutrient regeneration, and aided production of krill with a similar production as at the Antarctic with consumption by the other predators.
However, further along the high upwelling American western continental shelf where baleen whales also tend to migrate, the Ecopath model by 55 Field et al. (2006) for the Northern California Current found the phytoplankton production 6,600 t/Km2/year, about 3-fold higher than at Alaska. That gave a higher krill production of 216 tww/Km2/year but the baleen whale biomass was about half at 0.083 tww/Km2, and similar benthos production 110 tww/Km2/year. The contribution by the lower whale biomass by equations 4 and 5 show they could gave have provided 1568 (24%) and 63 tww/Km2/year (57%), to the Northern California Current production, respectively. The higher krill production is also consistent with the higher phytoplankton production, giving a similarly expected 227 tww/Km2/year krill production (Alaskan krill 69.7 x 6600/Alaskan PP 2028), indicating baleen whales contribute to upwelling driven production in coastal areas.
Discussion
The results raise fundamental questions about oceanographic processes required to bring the regenerated nutrient from whale defecation to surface waters. The interrelationships are briefly reviewed in relation to the global importance of the krill to whale food web and feedback loops of nutrient recycling, baleen whale migration and oceanic conditions in the open ocean.
Global nutrient recycling during whale migration
The actual increase on phytoplankton production in surface waters by baleen whale defecation is not well defined, particularly when feeding on fish during migrations. However, baleen whale defecation was shown by 56 to provide dissolved iron input to Antarctic surface waters, and that may apply during migration to warmer areas. The study by 57 suggested baleen whales undertake northern winter migrations after consuming large amounts of krill in the Southern Ocean during summer. That also occurs because the calves need warmer water temperatures to survive 58. During their long migrations to the temperate and tropical areas they consume small pelagic fish such as herring 59, anchovies 60 and benthopelagic species such as sand ells 31, which live and feed near the sea floor, in midwaters or near the surface, feeding on benthic as well as free swimming fish, apparently to provide additional energy and minimize weight loss. In terms of global migrations, and 61 suggested the Southern Ocean has an important role in the global ocean biogeochemistry for the chemical, physical, geological, and biological processes of the natural environment, as well as primary production by supplying nutrients to the global gravitational circulation and currents, caused by a sinking mass of dense sea water that moves toward the ocean floor due to gravity, winds, and the rotation of the earth.
In the Arctic Ocean, 62 showed baleen whales on the western Greenland continental shelf consume the high concentrations of krillMeganyctiphanes norvegica and Thysanoessasp. Those aggregations likely aid the start of migrations to the tropics during winter and 63 showed in the Arctic Ocean during summer, baleen whales mostly feed on Krill species or fish. In addition, 64 estimated globally, prior to the whale population being reduced by fishing, that whales contributed significant nutrient enrichment of surface waters by their high prey consumption providing increased fish production. That condition most likely applies at present because 65 estimated, post-whaling, the whale population has globally recovered by about 70%. In relation to obtaining fish food during migrations, 66 showed that by moving north from the Antarctic waters, baleen whales could also obtain food by consuming small pelagic fish by diving at productive seamount areas, which is briefly reviewed in the next section.
Migrations following deep sea seamounts
A detailed report on seamounts was presented in 67 and recent research on baleen whale migrations has found they tend to follow seamounts associated with nutrient release from hydrothermal vents 68, which act as hot springs on the ocean floor, releasing heated, mineral-rich water into the ocean water. In the South Pacific Ocean, whale migration occurs from the Southern Ocean to the large area of seamounts shown by 69 around New Zealand, mostly on the eastern side of the islands, where most whales are reported. The whales were probably following seamounts associate with the Southern Pacific Antarctic Ridge hydraulic vents, north of the Southern Ocean 70, see their Figure 1, and then along the east Coast of New Zealand via the Macquarie Ridge to the Campbell Plateau . The ridge then turns west via the Norfolk Island Ridge to New Caledonia, in the South West Pacific Ocean, where seamounts also occur 71.
The association of seamounts with whale migrations is reported by 72 who showed increased production of the waters associated with seamounts was due to upwelling of nutrients by interaction with local deep sea water currents of the Antarctic Circumpolar Current, an ocean current that flows clockwise (as seen from the South Pole) from west to east around Antarctica. In addition, 73 showed oceanic conditions at deep-water hydrothermal vents could provide increased phytoplankton production by upwelling of dissolved iron from the vent plume to surface waters of the Southern Ocean. That was confirmed by 74, who found ammonia and iron in vent plumes may reach some surface waters in temperate areas.
In the Arctic Ocean, humpback whales (Megaptera novaeangliae) are shown migrating from the Norwegian Svalbard archipelago in the Barents Sea to the Caribbean Islands, via Iceland, by 75, see their Figure 1. The migration was along the mid-Atlantic Ocean ridge deep-ocean hydrological vent map shown in 70 and deviated from the ridge to the eastern extent of islands in the Caribbean Sea. The return whale migration from the West Indies tended to follow the mid-Atlantic Ridge and went close to the Azore islands off the west coat of Africa, then rejoined the original migration path at Iceland. The comparison is consistent with seamounts associated with the mid-ocean ridges as important for pelagic fish and their predators 76, 77, 78 and 79.
Conclusions
The findings of this investigation present the importance of sustaining global baleen whale migrations to support ecosystem production by nutrient recycling, aided by oceanographic upwelling processes to surface waters in open ocean areas. In a related way, 80 suggested toothed whales bring nutrients from deep waters after feeding on fish and cephalopods, and the contribution could be similar to the gross nutrient dynamics in upwelling areas. They noted toothed whale defecation is mostly liquid and tends to disperse rather than sink, increasing surface water production. Therefore, it is suggested process be put in place to maintain global migration of all the great whales for sustainability of open ocean production.
Furthermore, the literature showed relationships between baleen whale defecation and nutrient cycling at seamounts and during baleen whale migrations, which also led to the effects of nutrient upwelling by deep sea currents at seamounts 81, apparently encouraging baleen whale migrations in those areas. Accordingly, 78 suggested seamounts be protected as important marine ecosystems. As seamounts are indicated as important for fish, particularly small pelagic fish and their whale predators, it is suggested small pelagic fish be sustained by ecosystem-based fishery management (EBFM) fishing rates, estimated by 36 as 23% ± 3% of the fishery biomass, and applied in the main global whale migration areas. Hence, further research is suggested to show how the baleen whale consumption and defecation processes sustains krill, fish, as well as phytoplankton and benthos biological production in open ocean areas. It is hoped that these insights for the ecological and oceanographic basis for krill and baleen whale feedback loops to sustain ecosystem production will be of assistance to fishery managers, biologists and ecosystem modellers for ongoing management of whale feeding and migration areas with potentially increased ecological stability of the world’s open ocean areas.
Declaration of interests
I have nothing to declare.
Funding sources
This research did not receive any specific grant from funding agencies in the public, commercial, or not-for-profit sectors.
Acknowledgements
There was no funding for this part of the study, which developed from comments by an independent unknown reviewer and previous studies on the biological principles of pelagic food webs as part of ecosystem-based fishery management.
References
- 1.Christensen V, Pauly D. (1992) ECOPATH II – A software for balancing steady-state ecosystem models and calculating network characteristics. , Ecol. Modelling 61, 169-185.
- 2.Ryabinin V, Barbière J, Haugan P, Kullenberg G, Smith N et al. (2019) The UN Decade of Ocean Science for Sustainable Development. , Front. Mar. Sci 6, 470-10.
- 3.White M, Bashmachnikov I, Arístegui J, Martins A. (2007) Physical processes and seamount productivity, in: Pitcher TJ, Morato. 62-84.
- 4.Nichols R C, Cade D E, Kahane-Rapport S, Goldbogen J, Stimpert A et al. (2022) Intra-seasonal variation in feeding rates and diel foraging behaviour in a seasonally fasting mammal, the humpback whale. , R. Soc. Open Sci 9, 211674-10.
- 5.Hodgson B R. (2025) Ecosystem-Based Fishery Management of Antarctic Krill (Euphausia superba) to Support Baleen Whales and other Predators Production Adapted for Potential Climate Change Effects. , Journal of Plant and Animal Ecology 2, 51-61.
- 6.Priddle J, Whitehouse M J, Ward P, Shreeve R S, Brierley A S et al. (2003) Biogeochemistry of a Southern Ocean plankton ecosystem: using natural variability in community composition to study the role of metazooplankton in carbon and nitrogen cycles. , J. Geophys. Res., Oceans 108, 8082-10.
- 7.Ratnarajah L, Bowie A R, Lannuzel D, Meiners K M, Nicol S. (2014) . The Biogeochemical Role of Baleen whales and Krill in Southern Ocean Nutrient Cycling. PLoS ONE 9(12), 114067-10.
- 8.Cavan E L, Belcher A, Atkinson A, Hill S L, Kawaguchi S et al. (2019) The importance of Antarctic krill in biogeochemical cycles. , Nat. Commun 10, 4742-10.
- 9.Peloquin J A, Smith Jr WO. (2007) Phytoplankton blooms in the Ross Sea, Antarctica: Interannual variability in magnitude, temporal patterns, and composition. , Journal of Geophysical Research: Oceans 112, 10-1029.
- 10.Meyer-Gutbrod E L, Greene C H, Sullivan P J, Pershing A J. (2015) Climate-associated changes in prey availability drive reproductive dynamics of the North Atlantic right whale population. , Mar Ecol Prog Ser 535, 243-258.
- 11.N R Record, J A Runge, D E Pendleton, W M Balch, K T Davies et al. (2019) Rapid climate-driven circulation changes threaten conservation of endangered North Atlantic right whales. , Oceanography 32, 162-169.
- 12.Kortsch S, Primicerio R, Fossheim M, Dolgov A V, Aschan M. (2015) Climate change alters the structure of arctic marine food webs due to poleward shifts of boreal generalists. , Proceedings of the Royal Society B: Biological Sciences 282(1814), 20151546-10.
- 13.McCormack S A, Melbourne-Thomas J, Trebilco R, Griffith G, Hill S L et al. (2021) Southern Ocean Food Web Modelling: Progress, Prognoses, and Future Priorities for Research and Policy Makers. , Front. Ecol. Evol 9, 624763-10.
- 14.Carmack E, Wassmann P. (2006) Food webs and physical–biological coupling on pan-Arctic shelves: unifying concepts and comprehensive perspectives. Progress in Oceanography 71, 446-477.
- 15.Skern-Mauritzen M, Johannesen E, Bjørge A, Øien N. (2011) Baleen whale distributions and prey associations in the Barents Sea. Mar Ecol Prog Ser 426:. 289-301.
- 16.Falkowski P G, Barber R T, Smetacek V. (1998) Biogeochemical controls and feedbacks on ocean primary production. , science 281(5374), 200-206.
- 17.Gilbert L, Jeanniard-du-Dot T, Authier M, Chouvelon T, Spitz J. (2023) Composition of cetacean communities worldwide shapes their contribution to ocean nutrient cycling. , Nat. Commun 14, 5823-10.
- 18.Roman J, J. (2010) The whale pump: marine mammals enhance primary productivity in a coastal basin. , PLoS ONE 5, 13255-10.
- 19.Roman J, J A Estes, Morissette L, Smith C, Costa D et al. (2014) Whales as marine ecosystem engineers. , Front. Ecol. Environ 12, 377-385.
- 20.T J Lavery, Roudnew B, Seymour J, J G Mitchell, Smetacek V et al. (2014) Whales sustain fisheries: blue whales stimulate primary production in the Southern Ocean. , Mar. Mammal Sci 30, 888-904.
- 21.M S Savoca, M F Czapanskiy, S R Kahane-Rapport, W T Gough, J A Fahlbusch et al. (2021) Baleen whale prey consumption based on high-resolution foraging measurements. , Nature 599, 85-90.
- 22.Durfort A, Mariani G, Tulloch V, Savoca M S, Troussellier M et al. (2022) Recovery of carbon benefits by overharvested baleen whale populations is threatened by climate change. Proc. R. Soc. B 289: 20220375-10.
- 23.Fleming A, Jackson J. (2011) Global Review of Humpback Whales (Megaptera novaeangliae). U.S. Department of Commerce, National Oceanic and Atmospheric Administration, National Marine Fisheries Service. NOAA technical memorandum NMFS; NOAA-TM-NMFS-SWFSC ; 474-4489.
- 24.P O Thomas, R, Jr Brownell, L R. (2016) Status of the world's baleen whales. , Marine Mammal Science 32(2), 682-734.
- 25.Hutchings L, Pitcher G C, Probyn T A, Bailey G W. (1995) The chemical and biological consequences of coastal upwelling. in: Summerhayes CP, Emeis KC, Angel MV, Smith RL, Zeitzschel B (eds). Upwelling in the ocean: modern processes and ancient records. , New York 64-81.
- 26.Horton T W, Palacios D M, Stafford K M, Zerbini A N. (2022) Baleen whale Migration. In:. Clark CW, Garland EC (eds), Ethology and Behavioral Ecology of Mysticetes . Ethology and Behavioral Ecology of Marine Mammals , Cham, Chapter 4, 71-14.
- 27.Avila I C, Dormann C F, García C, Payán L F, Zorrilla M X. (2020) Humpback whales extend their stay in a breeding ground in the Tropical Eastern Pacific. , ICES J. Mar. Sci 77, 109-118.
- 28.D A Croll, Marinovic B, Benson S, F P Chavez, Black N et al. (2005) From wind to whales: trophic links in a coastal upwelling system. , Mar. Ecol. Prog. Ser 289, 117-130.
- 29.Buchary E A, Alder J, Nurhakim S, Wagey T. The Fisheries Centre, University of British (2002) The Use of Ecosystem-based Modelling to Investigate Multi-species Management Strategies for Capture Fisheries in the Bali Strait, Indonesia Page 24, in: Pitcher T, and Cochrane K, Editors. The Use of Ecosystem Models to Investigate Multispecies Management Strategies for Capture Fisheries. , Fisheries Centre Research Reports 10, 156.
- 30.Koslow J A, Pesant S, Feng M, Pearce A, Fearns P et al. (2008) The effect of the Leeuwin Current on phytoplankton biomass and production off Southwestern Australia. , J. Geophys. Res 113, 10-1029.
- 31.Morissette L, LR Kaschner K Gerber. (2010) Whales eat fish’? Demystifying the myth in the Caribbean marine ecosystem. , Fish and Fisheries 11, 388-404.
- 32.Guénette S, Morato T. The Fisheries Centre, University of British Columbia (2001) The Azores Archipelago in 1997., PART 3. NORTHEAST ATLANTIC In: Editors Guénette. https://open.library.ubc.ca/media/stream/pdf/52383/1.0348145/5#page=247 , Fisheries Centre Research Reports 9, 241-270.
- 33.O A Amir, Berggren P, N S Jiddawi. (2012) Recent records of marine mammals in Tanzanian waters. , J. Cetacean Res. Manage 12, 249-253.
- 34.K R Tenore. (1988) Nitrogen in benthic food chains. Chapter 9 In:. Nitrogen Cycling in Coastal Marine Environments (eds. Blackburn, TH & Sörensen. J.) , New York 191-206.
- 35.Baines M, J A, Fielding S, Warwick-Evans V, Reichelt M et al. (2022) Ecological interactions between Antarctic krill (Euphausia superba) and baleen whales in the South Sandwich Islands region–Exploring predator-prey biomass ratios. Deep Sea Research Part I: Oceanographic Research Papers. 189, 103867-10.
- 36.Hodgson B R. (2022) An analytical solution to ecosystem-based FMSY using trophic transfer efficiency of prey consumption to predator biological production. , PLoS ONE 17(11), 0276370-10.
- 37.Sherman K. (1991) The large marine ecosystem concept: research and management strategy for living marine resources. , Ecol. Appl 1, 349-360.
- 38.Lewis K M, van Dijken GL, Arrigo K R. (2020) Changes in phytoplankton concentration now drive increased Arctic Ocean primary production. , Science 369(6500), 198-202.
- 39.Surma S, Pakhomov E A, Pitcher T J. (2014) Effects of Whaling on the Structure of the Southern Ocean Food Web: Insights. on the “krill Surplus” from Ecosystem Modelling. PLoS ONE 9(12): e114978. https://doi.org/10.1371/journal.pone.0114978 See S4. Ecopath and Ecosim model parameters in https://doi.org/10.1371/journal.pone.0114978.s001 .
- 40.Cornejo-Donoso J, Antezana T. (2008) Preliminary trophic model of the Antarctic Peninsula Ecosystem (Sub-area CCAMLR 48.1). Ecological Modelling 218:. 1-17.
- 41.Hill S L, Keeble K, Atkinson A, Murphy E J. (2012) A foodweb model to explore uncertainties in the South Georgia shelf pelagic ecosystem. Deep Sea Research Part II:. , Topical Studies in Oceanography 59, 237-252.
- 42.Pinkerton M H. (2013) Ecosystem Modelling of the Chatham Rise. Prepared for Chatham Rock Phosphate. NIWA Client Report No: WLG2013-17, Report date: NIWA Project: CRP12302
- 43.Dommasnes A, Christensen V, Ellertsen B, Kvamme C, Melle W et al. (2001) An Ecopath model for the Norwegian Sea and Barents Sea, in:. , Columbia, Canada, Guénette 213-240.
- 44.Pedersen T, Mikkelsen N, Lindstrøm U, Renaud P E, Nascimento M C et al. (2021) . Overexploitation, Recovery, and Warming of the Barents Sea Ecosystem During 1950–2013. Front. Mar. Sci 8, 732637-10.
- 45.Ribeiro J P, BÞ Elvarsson, Sturludóttir E, Stefánsson G. (2018) An overview of the marine food web in Icelandic waters using Ecopath with Ecosim. arXiv preprint arXiv:. 1810-00613.
- 46.Okey T A, Pauly D. (1999) Trophic Mass-Balance Model of Alaska’s Prince William Sound Ecosystem, for the Post-Spill Period 1994-1996: 2nd Edition Fisheries Centre research reports. 7, 136-52383.
- 47.Koehn L E, Essington T E, Marshall K N, Kaplan I C, Sydeman W J et al. (2016) Developing a high taxonomic resolution food web model to assess the functional role of forage fish in the California Current ecosystem. , Ecol. Modelling 335, 87-100.
- 48.Bentley J W, Serpetti N, Heymans J J. (2017) Investigating the potential impacts of ocean warming on the Norwegian and Barents seas ecosystem using a time-dynamic food-web model. , Ecol. Model 360, 94-107.
- 50.Santora J A, Reiss C S, Loeb V J, Veit R R. (2010) Spatial association between hotspots of baleen whales and demographic patterns of Antarctic krill Euphausia superba suggests size-dependent predation. Mar Ecol Prog Ser 405:. 255-269.
- 51.Pinkerton M H, Bradford-Grieve J, Sagar P M. (2008) . Whales: Trophic modelling of the Ross Sea. CCAMLR 28-04.
- 52.Morley S A, Souster T A, Vause B J, Gerrish L, Peck L S et al. (2022) Benthic Biodiversity, Carbon Storage and the Potential for Increasing Negative Feedbacks on Climate Change in Shallow Waters of the Antarctic Peninsula. Biology. 11-320.
- 53.Gogina M, Zettler A, Zettler M L. (2022) Weight-to-weight conversion factors for benthic macrofauna: recent measurements from the Baltic and the North seas. , Earth Syst. Sci. Data 14, 10-5194.
- 54.Reilly S, Hedley S, Borberg J, Hewitt R, Thiele D et al. (2004) Biomass and energy transfer to baleen whales in the South Atlantic sector of the Southern Ocean. Deep Sea Research Part II:. , Topical Studies in Oceanography 51, 1397-1409.
- 55.M S Savoca, Kumar M, Sylvester Z, M F Czapanskiy, Meyer B et al. (2024) Whale recovery and the emerging human-wildlife conflict over Antarctic krill. , Nature Communications 15, 7708-10.
- 56.Field J C, Francis R C, Aydin K. (2006) Top-down modeling and bottom-up dynamics: Linking a fisheriesbased ecosystem model with climate hypotheses in the Northern California Current. Progress in Oceanography 68: 238-270.
- 57.Nicol S, Bowie A, Jarman S, Lannuzel D, Meiners K M et al. (2010) Southern Ocean iron fertilization by baleen whales and Antarctic krill. , Fish and Fisheries 11, 203-209.
- 58.Biuw M, Lindstrøm U, Jackson J A, Baines M, Kelly N et al. (2024) Estimated summer abundance and krill consumption of fin whales throughout the Scotia Sea during the 2018/2019 summer season. , Sci Rep 14, 7493.
- 59.Rasmussen K, Palacios D M, Calambokidis J, Saborio M T, Dalla Rosa L et al. (2007) Southern Hemisphere humpback whales wintering off Central America: insights from water temperature into the longest mammalian migration. , Bio Lett 3, 302-305.
- 60.AMG Cegarra, Castro C, K Van Waerebeek. (2021) Feeding of humpback whales in low latitudes of the Southeast Pacific Ocean. , Neotrop. Biodivers 7, 421-430.
- 61.Frisch-Jordán A, Ransome N L, Aranda-Mena O, Romo-Sirvent F. (2019) Intensive feeding of humpback whale (Megaptera novaeangliae) in the breeding ground of Banderas Bay. , Mexico. Latin, American. Journal of Aquatic Mammals 14, 27-33.
- 62.Henley S F, Cavan E L, Fawcett S E, Kerr R, Monteiro T et al. (2020) Changing biogeochemistry of the Southern Ocean and its ecosystem implications. , Front. Mar. Sci 7, 581-10.
- 63.Laidre K L, Heide-Jørgensen M P, Heagerty P, Cossio A, Bergström B et al. (2010) Spatial associations between large baleen whales and their prey in West Greenland. Mar Ecol Prog Ser. 402, 269-284.
- 64.L E Kettemer, Ramm T, Broms F, Biuw M, M A Blanchet et al. (2023) Don’t mind if I do: Arctic humpback whales respond to winter foraging opportunities before migration. , R. Soc. Open Sci 10(9), 230069-10.
- 65.Doughty C E, Roman J, Faurby S, Wolf A, Haque A et al. (2016) Global nutrient transport in a world of giants. Proceedings of the National Academy of Sciences (PNAS) 113, 868-873.
- 66.Seyboth E, Meynecke J-O, J de Bie, Roychoudhury A, Findlay K. (2023) A review of post-whaling abundance, trends, changes in distribution and migration patterns, and supplementary feeding of Southern Hemisphere humpback whales. , Front. Mar. Sci.: 997491-10.
- 67.Derville S, Torres L G, Zerbini A N, Oremus M, Garrigue C. (2020) Horizontal and vertical movements of humpback whales inform the use of critical pelagic habitats in the western South Pacific. , Sci Rep 10, 4871.
- 68.Pitcher T J, Morato T, Hart P J, Clark M R, Haggan N et al. (2007) Chapter 21, The Depths of Ignorance: An Ecosystem Evaluation Framework for Seamount Ecology, Fisheries and Conservation, in: Seamounts: ecology, fisheries and conservation. Blackwell Fisheries and Aquatic Resources Series 12, 476-488.
- 69.S G, Tamburini C, Gollner S, Guilloux B, Pape E et al. (2025) Deep Sea Research and Management Needs. In: (Eds.) Muñiz. Future Science Brief No. 12 of the European Marine Board , Ostend, Belgium. DOI: .
- 70.Rowden A A, Clark M R, Wright I C. (2005) Physical characterisation and a biologically focused classification of “seamounts” in the New Zealand region. , N. Z. J. Mar. Freshw. Res 39, 1039-1059.
- 71.German C R, Ramirez-Llodra E, Baker M C, Tyler P A. (2011) the ChEss Scientific Steering Committee. Deep-Water Chemosynthetic Ecosystem Research during the Census of Marine Life Decade and Beyond: A Proposed Deep-Ocean Road Map. PLoS ONE 6(8): 23259-10.
- 72.Garrigue C, Clapham P J, Geyer Y, Kennedy A S, Zerbini A N. (2015) Satellite tracking reveals novel migratory patterns and the importance of seamounts for endangered South Pacific humpback whales. , R. Soc. Open 2, 150489-10.
- 73.Sergi S, Baudena A, Cotté C, Ardyna M, Blain S et al. (2020) Interaction of the Antarctic Circumpolar Current with Seamounts Fuels Moderate Blooms but Vast Foraging Grounds for Multiple Marine Predators. , Front. Mar. Sci 7, 416-10.
- 74.Ardyna M, Lacour L, Sergi S, d’Ovidio F, Sallée J B et al. (2019) Hydrothermal vents trigger massive phytoplankton blooms in the Southern Ocean. , Nat. Commun 10, 2451.
- 75.Dick G J, Anantharaman K, Baker B J, Li M, Reed D C et al. (2013) The microbiology of deep-sea hydrothermal vent plumes: ecological and biogeographic linkages to seafloor and water column habitats. Sec. Extreme Microbiology Volume 4 – 2013 doi: 10.3389/fmicb.2013.00124 , Front. Microbiol 21, 10-3389.
- 76.Kettemer L E, Rikardsen A H, Biuw M, Broms F, Mul E et al. (2022) Round-trip migration and energy budget of a breeding female humpback whale in the Northeast Atlantic. , PLOS ONE 17(5), 0268355-10.
- 77.Morato T, Hoyle S D, Allain V, Nicol S J. (2010) Seamounts are hotspots of pelagic biodiversity in the open ocean. , Proc. Natl. Acad. Sci 107, 9707-9711.
- 78.Kennedy A S, Zerbini A N, Vásquez O V, Gandilhon N, Clapham P J et al. (2013) Local and migratory movements of humpback whales (Megaptera novaeangliae) satellite-tracked in the North Atlantic Ocean. , Can. J. Zool 92, 8-17.
- 79.Watling L, Auster P J. (2017) Seamounts on the High Seas Should Be Managed as Vulnerable Marine Ecosystems. , Front. Mar. Sci 4, 14-10.
- 80.Rogers A D. (2018) Chapter Four - The Biology of Seamounts: 25 Years on. , Adv. Mar. Biol 79, 137-224.