
Fine and Ultrafine Particle Pollution Before and After a Smoking ban in the Catering Industry in Vienna
Abstract
In the catering industrytobacco smoke was the primary source of fine and ultrafine particles, which are well known for their health-damaging effects. As shown in studies, attempts to reduce passive smoking in the catering industry of Vienna, like separated smoking rooms, failed to reduce fine and ultrafine particle concentrations effectively. On November 1st 2019, an enlarged non-smoker’s protection law was introduced, including a total smoking-ban in the catering industry. 40 hospitality venues with areas for smokers and non-smokers before the ban had been selected as typical Viennese cafes, pubs, bars and discotheques to be sampled unannounced. Concentrations of fine particle mass (PM10, PM2.5, PM1) and ultrafine particle number (PNC) and lung deposited surface area (LDSA) could be measured before and after the introduction of the smoking-ban in 39 venues at nearly identical locations and under comparable circumstances. Results showed a statistically significant decline in both fine and ultrafine particle concentrations in the former smoking areas for all parameters as well as in the former non-smoking areas for PM2.5, PM1 and LDSA. After the ban concentrations in former smoking areas and non-smoking areas showed no significant differences any more. From these results the smoking-ban successfully removed particles from breathing air of guests and staff, however, some outliers in the study after the ban point to the necessity of repeated controls in Vienna. Also, outside Vienna the compliance with the law should be controlled in the Austrian hospitality industry.
Article Information
- Received
- Accepted
- Published
Academic Editor: Sasho Stoleski, Institute of Occupational Health of R. Macedonia, WHO CC and Ga2len CC, Macedonia.
Checked for plagiarism: Yes
Review by: Single-blind
Copyright © 2021 Annika K. Sima, et al.
 This is an open-access article distributed under the terms of the Creative Commons Attribution License, which permits unrestricted use, distribution, and reproduction in any medium, provided the original author and source are credited.
Corresponding author: Manfred Neuberger, Medical University of Vienna, Centre of Public Health; A-1090 Wien, Kinderspitalgasse 15, Austria —
Competing Interests
The authors have declared that no competing interests exist.
Funding
This research received no external funding, except for the costs of the measurement instruments and their calibration, which were carried by the Commission on Climate and Air Quality of the Austrian Academy of Science.
Data Availability
Data supporting reported results can be found in https://repositorium.meduniwien.ac.at, except for personal ones protected by data protection law, which cannot be deposited in publicly archived datasets.
Acknowledgements
This study was financially supported by the Austrian Academy of Science (Commission on Climate and Air Quality), which provided the measurement instruments. The researching students of the foregoing study, Sarah Wiesner 11 and Michael Raab 12, provided data of their diploma theses on particle pollution in the Viennese catering industry before the smoking ban.
Citation:
Introduction
Fine and ultrafine particles as atmospheric aerosols contribute to hazardous air pollution, mainly deriving from anthropogenic burning processes such as combustion engines, industry, heating and tobacco smoking. 1 Whereas concentrations of fine particles are classified by their aerodynamic diameter as particulate matter ≤ 10 μm (PM10), particulate matter ≤ 2.5 μm (PM2.5) and particulate matter ≤ 1 μm (PM1), 2, 3 concentrations of ultrafine particles are classified by their number (Particulate Number Concentration, PNC) as well as their effective surface (Lung Deposited Surface Area, LDSA). 4
Studies have shown that fine and ultrafine particles cause multiple negative effects on human health. 5, 6, 7, 8 The tinier a particle’s diameter, the more easily is its movement into the deeper airways, implying a greater damage potential. 9 Acute, subacute and long-term effects of exposure to high concentrations of fine particles result in higher morbidity, hospital admissions and higher mortality. 2, 7, 8
One of the most common sources of fine and ultrafine particles in closed spaces is tobacco smoke. 10, 11, 12 Preventively, the World Health Organisation (WHO) has formulated guidelines to limit the ambient pollutant concentrations of fine particles. Hence, in a 24-hours-mean, PM10 is limited to 50 μg/m3 and PM2.5 to 25 μg/m3. In a yearly mean, PM10 is limited to 20 μg/m3 and PM2.5 to 10 μg/m3. The WHO has proposed to deploy these restrictions for closed spaces as well. However, concentration limits of ultrafine particles as well as PM1 have not been suggested yet. 3
Concerning the WHO’s suggestions, guidelines for ambient fine particle concentration limits were introduced in Austria. Thus, limited daily means of fine particle concentration were set for PM10 to 50 μg/m3, limited yearly means for PM10 to 40 μg/m3 and for PM2.5 to 25 μg/m3. For PM2.5, no daily mean concentration limit has been set yet. Also, there have neither been guidelines for ultrafine particle concentration or PM1 nor suggestions of concentration limits in closed spaces. 10, 13
To protect non-smokers from passive smoke in the catering industry, the Austrian legislation requested with 1st January 2009 among other things separated smoking and non-smoking areas in gastronomic facilities larger than 80 m2. 14 Nevertheless, as smoking had still been permitted in the smoking areas and experience has shown that separation of the areas was not performed as thoroughly as demanded, doubts of meeting the concentration limits were raised, whereas a study was launched by the Medical University of Vienna from April to October 2019. In this study, two students measured the concentration of fine and ultrafine particulate matter of passive smoke in 40 randomly chosen gastronomic venues, comparing the smoking to the non-smoking area. Results of this study have shown that in spite of separated areas, in many facilities it had not been possible to meet the Austrian guidelines, much less the WHO’s suggestions, due to passive smoke. 11, 12, 14
Alongside, after years of debates, Austria’s legislation enlarged the so-called “Non-Smoker’s Protection Law” on November 1st 2019, introducing a smoking-ban regarding the whole catering industry. Through this law, all kinds of smoking got prohibited indoors. Furthermore, all gastronomic locations have to mark themselves visibly as smoke free. 15
On account of this enlarged law, this study is rested. Therefore, its aim is to compare the concentrations of fine and ultrafine particulate matter before to after introducing the smoking ban into Austrian gastronomy, differentiated between formerly smoking and non-smoking areas. Thus, a repeated cross-sectional study on a sample of hospitality venues was created.
Materials and Methods
As to collect samples of fine and ultrafine particle concentration before introducing the smoking-ban, first study measurements were performed from April to October 2019 in 40 randomly chosen, well frequented catering facilities of different types, such as pubs, restaurants, bars, discotheques and cafeterias in Vienna. 11 From November 2019 to March 2020, the measurements were repeated, visiting the same venues considering approximately similar settings, including the same rooms, related time of the recordings and similar weekdays (differencing between days during a week and the weekend), however, to well frequented times (cafes in the afternoon, discotheques at night). One venue of the first study had to be excluded in the second study, because it was closed, whereas recordings were taken in 39 gastronomy facilities before COVID-19 shutdown started. Each facility had separate smoking and non-smoking areas before November 2019, hence in each area a measurement was undertaken. Each recording lasted 20-30 minutes and, such as to avoid selection bias from permission, was unannounced and hidden while consuming. As devices, GRIMM® Aerosol Spectrometer 1.108 for fine particulate matter, detecting particles bigger than 300 nanometres, and MiniDiSC®, detecting particles of 10-300 nanometres in diameter, for ultrafine particulate concentration were chosen. Measurement methods were described earlier. 16, 17, 18, 19
After collecting the data, the differences of concentrations between these two (formerly) areas were analysed and the differences of concentrations before to after introducing the smoking ban. The various mean concentrations of both studies were compared using statistics, including primarily paired t-testing as well as visual descriptions like boxplots via IBM SPSS Statistics Subscription®. The results were assessed to a confidence interval of 95%, therefore, contrasted against the significance level of p=0.05.
Results
Contrasted against p=0.05, statistics show statistically significant declines of fine particle concentrations of PM10, PM2.5 and PM1 in former smoking areas as well as of PM2.5 and PM1 in former non-smoking areas, as shown in Table 1 and Figure 1. As for ultrafine particle concentration, statistically significant declines of PNC were registered in former smoking areas. In former non-smoking areas, the PNC decline was not significant. Considering LDSA, in both areas statistically significant declines were shown (Table 2, Figure 2, Figure 3).
Figure 1. Fine particle mass PM10, PM2.5 and PM1 (µg/m³) in 39 hospitality venues before and after introducing the smoking-ban in all areas. Outliers are indicated by circles (1.5-3.0 x IQR) and stars (>3.0 x IQR).
Download figure
Figure 2. Ultrafine particle number concentration/cm³ in 39 venues before and after introducing the smoking-ban, by areas. Significant differences indicated by p<0.001, outliers indicated by circles (1.5-3.0 x IQR) and stars (>3.0 x IQR).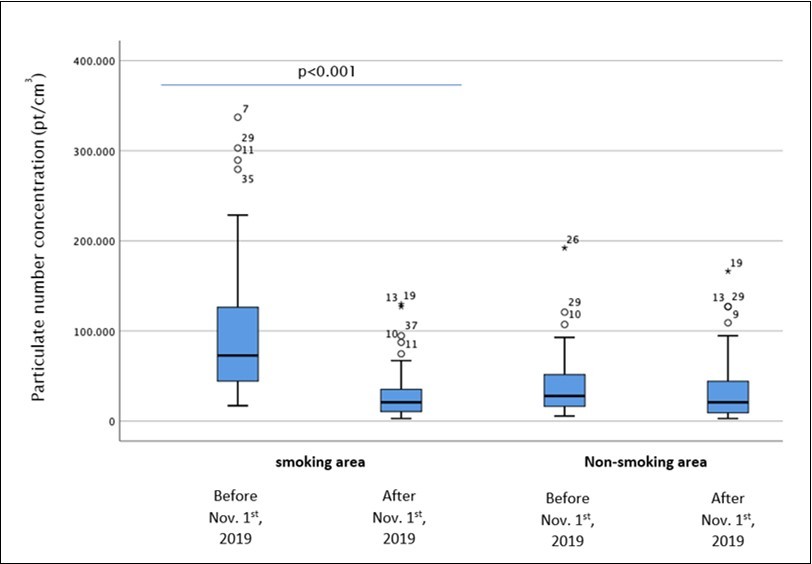
Download figure
Figure 3. Ultrafine particle surface (LDSA) concentrations (µm²/cm³) before and after introducing the smoking-ban, by areas. Significant differences indicated by p<0.01 and p<0.05, outliers indicated by circles (1.5-3.0 x IQR) and stars (>3.0 x IQR).
Download figure
| 95% confidence interval of differences | T | df | Sig. (2-sided) | ||||||
| Mean | Standard deviation | Standard error of mean | Lower value | Upper value | |||||
| Pair 1 | beforeSPM10- afterSPM10 | 119.034 | 149.816 | 24.303 | 69.791 | 168.278 | 4.898 | 37 | 0.000 |
| Pair 2 | beforeNSPM10 - afterNSPM10 | 22.411 | 68.427 | 11.566 | -1.094 | 45.917 | 1.938 | 34 | 0.061 |
| Pair 3 | beforeSPM2.5 - afterSPM2.5 | 121.006 | 136.585 | 22.157 | 76.112 | 165.901 | 5.461 | 37 | 0.000 |
| Pair 4 | beforeNSPM2.5- afterNSPM2.5 | 29.557 | 70.819 | 11.971 | 5.230 | 53.885 | 2.469 | 34 | 0.019 |
| Pair 5 | beforeSPM1 - afterSPM1 | 106.264 | 122.758 | 20.181 | 65.335 | 147.195 | 5.265 | 36 | 0.000 |
| Pair 6 | beforeNSPM1- afterNSPM1 | 25.982 | 61.699 | 10.429 | 4.788 | 47.177 | 2.491 | 34 | 0.018 |
| 95% confidence interval of differences | T | df | Sig. (2-sided) | ||||||
| Mean | Standard deviation | Standard error of mean | Lower value | Upper value | |||||
| Pair 1 | beforeSPNC- afterSPNC | 76724.690 | 84008.941 | 14850.823 | 46436.234 | 107013.140 | 5.166 | 31 | 0.000 |
| Pair 2 | beforeNSPNC - afterNSPNC | 3518.939 | 49925.829 | 8207.756 | -13127.161 | 20165.040 | 0.429 | 36 | 0.671 |
| Pair 3 | beforeSLDSA- afterSLDSA | 384.810 | 332.852 | 58.841 | 264.804 | 504.816 | 6.540 | 31 | 0.000 |
| Pair 4 | beforeNSLDSA - afterNSLDSA | 67.879 | 157.620 | 25.913 | 15.326 | 120.432 | 2.620 | 36 | 0.013 |
Fine and ultrafine particle concentrations after introducing the smoking ban were not significantly different between the former smoking and former non-smoking areas. (Table 3 and Table 4, Figure 4, Figure 5, Figure 6)
Table 3. t-Test with paired samples comparing areas after smoking ban (PM10, PM2.5, PM1)| 95% confidence interval of differences | T | df | Sig. (2-sided) | ||||||
| Mean | Standard deviation | Standard error of mean | Lower value | Upper value | |||||
| Pair 1 | afterSPM10 - afterNSPM10 | 7.444 | 40.982 | 7.028 | -6.855 | 21.743 | 1.059 | 33 | 0.297 |
| Pair 2 | afterSPM2.5 - afterNSPM2.5 | 4.957 | 19.183 | 3.290 | -1.736 | 11.651 | 1.507 | 33 | 0.141 |
| Pair 3 | afterSPM1 - afterNSPM1 | 3.210 | 11.528 | 1.977 | -.8121 | 7.233 | 1.624 | 33 | 0.114 |
| 95% confidence interval of differences | T | df | Sig. (2-sided) | ||||||
| Mean | Standard deviation | Standard error of mean | Lower value | Upper value | |||||
| Pair 1 | afterNSPNC- afterSPNC | 6167.783 | 28884.296 | 5273.527 | -4617.790 | 16953.357 | 1.170 | 29 | 0.252 |
| Pair 2 | afterNSLDSA - afterSLDSA | -1.748 | 61.225 | 11.178 | -24.610 | 21.114 | -0.156 | 29 | 0.877 |
Figure 4. Fine particle mass PM10, PM2.5 and PM1 concentrations in formerly separated areas after introduction of the smoking-ban. Outliers indicated by circles (1.5-3.0 x IQR) and stars (>3.0 x IQR).
Download figure
Figure 5. PNC in formerly separated areas after introduction of the smoking-ban. Outliers indicated by circles (1.5-3.0 x IQR) and stars (>3.0 x IQR).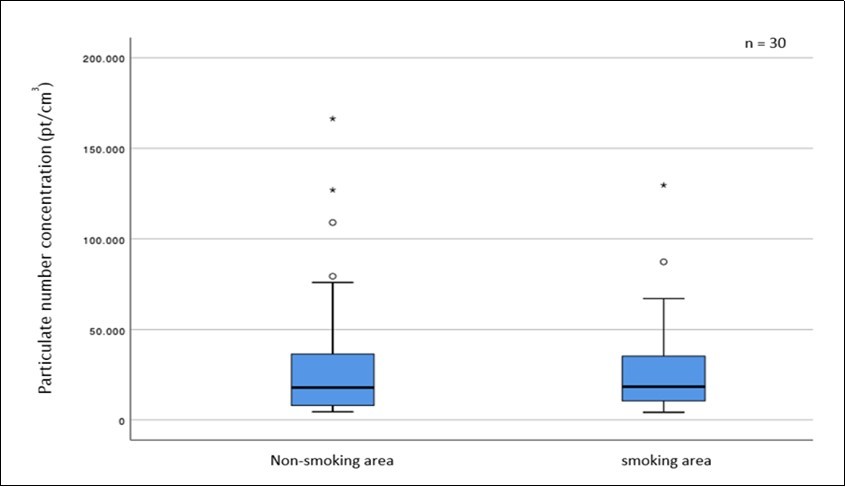
Download figure
Figure 6. LDSA concentrations in formerly separated areas after introduction of the smoking-ban. Outliers indicated by circles (1.5-3.0 x IQR) and stars (>3.0 x IQR).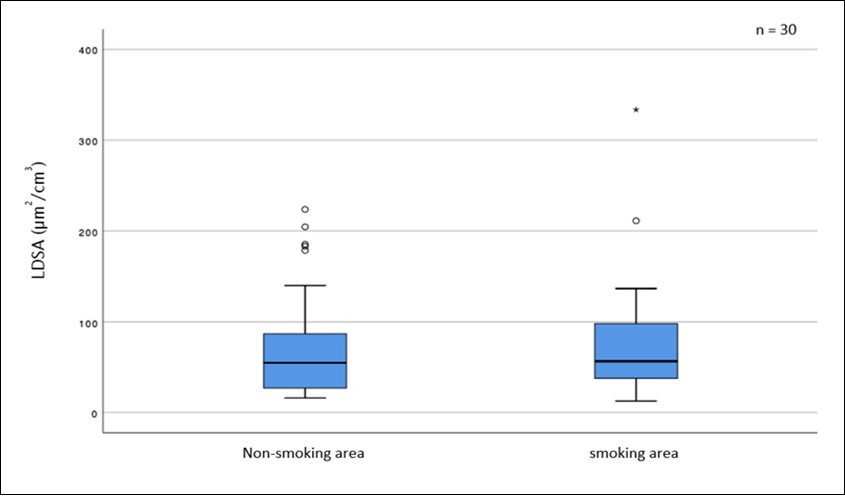
Download figure
Overall, concerning the comparison before to after the introduction of the smoking-ban, in each area were found remarkable declines of fine as well as ultrafine particle concentrations, statistically significant in smoking areas for PM10, PM2.5, PM1, PNC and LDSA and in non-smoking areas for PM2.5, PM1 and LDSA. No statistically significant declines were registered in non-smoking areas for PM10 and PNC. After the ban, there were no significant differences of concentrations found anymore between former smoking and non-smoking areas.
Discussion
In comparison to the smoking areas before the ban statistically significant declines of fine and ultrafine particle concentrations indicate reduced passive smoking in the Viennese hospitality industry, which is a successful development. Also, these results underline the effectiveness of the new legislation to protect the population against the harmful effects of fine and ultrafine particles from second-hand smoke. The decline of PM10 in former non-smoking areas was not significant, which might be due to renovation and other sources of PM10, stirred up and resuspended by walking of guests and waiters. The high variance of PNC in the non-smoking area might have been due to illegal smoking shortly before the air sample was taken, which could explain some very high concentrations at single venues, especially if concomitant with high LDSA and PM1 in the room. But the big variance of PNC in the non-smoking area could partly be explained also by other possible combustion (e.g. candles which have been excluded at the table of the researcher only) and condensation products, highly variable in time and space.
Prior to the smoking ban indoor smoke exposures were highest in the smoking rooms, followed by adjacent rooms and lowest outdoors. There were no significant differences in concentrations between the smoking and non-smoking areas after the smoking ban entered into force. Therefore, one could diagnose that the indoor air quality was considerably improved. 11, 12 However, some outliers in this study after the ban show the necessity of repeated controls in Vienna. Also, outside Vienna the compliance with the law should be controlled in the Austrian hospitality industry. The goal should be the enforcement of the law in all hospitality venues, complete disappearance of ash trays indoors and at the entrance, indoor air concentrations of PM2.5 below 25 µg/m³3 and PNC below 10,000 pt/cm³18.
Limitations and Strengths
Throughout the repeated cross-sectional study on a sample of hospitality venues, most venues could be visited a second time before the COVID-19 epidemic reached Vienna. Nevertheless, some venues had been adjusted meanwhile to the new law by removing barriers between the former smoking and non-smoking area. Some rooms had also been closed and the sample could not be taken anymore at the same location. Further studies are proposed after lockdowns for COVID-19 ended. By future studies with larger sample sizes, more precise data of the air quality in the catering industry after the smoking-ban could be collected, including chemical analyses of remaining SHS and THS. Moreover, possible confounding factors could be investigated more sensitively.
A strength of this study is that the results showed a high statistical significance, despite of the small sample size. As the samples were taken without any advance-notice, it could be ensured that the results have not been distorted by selection bias from participation. This is a strength for gaining chance samples of true exposures in busy venues, but on the other hand masked sampling did not allow measurements of ventilation, etc. before and after the smoking ban. However, sampling time, sampling location and visual inspection indicated comparable environmental conditions at first and second visit, except for renovated venues or rooms which were excluded from the comparisons. Unannounced and hidden sampling while consuming a drink in central parts of venues, omitting sinks (near open doors and windows) and sources of tobacco smoke (smoker at the same table) was a strategy used before 10 and proved to be successful to differentiate particulate pollution in smoking rooms, adjacent non-smoking rooms, and non-smoking venues .10, 20 Here it was applied for the first time in Austria on each venue in the same location before and after the smoking ban at comparable day of week and time of day (busy hours). Studies on air quality allow quick estimates of compliance to indoor smoking bans.21, 22 Future studies should use indicators of individual exposure like cotinine, which allow better estimations of health effects.23
Conclusion
To conclude, by this study’s statistics and interpretation the suggestion of the smoking-ban’s effectiveness on Viennese gastronomy is given. Additional controls are necessary to verify compliance with tobacco legislation in the Austrian catering industry.
Affiliations
Medical University of Vienna, Centre of Public Health; A-1090 Wien, Kinderspitalgasse 15, Austria
Author Contributions
Conceptualization, M.N.; data collection and analysis, A.K.S. and A.M.S; writing—original draft preparation, A.K.S. and A.M.S; writing—review and editing, A.K.S and M.N.; visualization, A.K.S. and A.M.S; supervision, project administration, funding acquisition, M.N. All authors have read and agreed to the published version of the manuscript.
Institutional Review Board Statement
Not applicable. Due to taking measurements of fine and ultrafine particle concentrations exclusively as well as not using either personalised data nor involving any other beings in this study, it could be desisted from any ethical requests. Apart from the risk of polluted air to the study team, no risky issues were found in this study. All maintained data, e.g. the addresses or names of the monitored facilities, were kept secret by the study’s team members.
Abbreviations
- IQR = Interquartile rangePM10 = Particulate Matter ≤ 10 μm aerodynamic diameterPM2.5 = Particulate Matter ≤ 2.5 μm aerodynamic diameterPM1 = Particulate Matter ≤ 1 μm aerodynamic diameterPNC = Particulate Number ConcentrationLDSA = Lung Deposited Surface Area (alveolar)SHS = Second hand smokeTHS = Third hand smokeWHO = World Health Organisation
References
- 1.Strasser G, Hiebaum S, Neuberger M. (2018) Commuter exposure to fine and ultrafine particulate matter. in Vienna.Wiener klinische Wochenschrift.130(1): 62-69.
- 2.Environment Agency Austria. Luftschadstoffe, Feinstaub PM10. Available online:https://www.umweltbundesamt.at/umweltthemen/luft/luftschadstoffe/staub/pm10. [accessed on 14.01.2021].
- 3.Health World.Organisation. Ambient (outdoor) air pollution. Available online:https://www.who.int/news-room/fact-sheets/detail/ambient-(outdoor)-air-quality-and-health. [accessed on 14.01.2021]
- 4.Buxbaum I, Nagl C. (2018) Ultrafeine Partikel, Black Carbon. Umweltbundesamt Österreich:. , Vienna
- 5.Health World.Organisation. Air quality. Available online:https://www.euro.who.int/en/health-topics/environment-and-health/air-quality/air-quality. [accessed on 14.01.2021]
- 6.IARC.Outdoor air pollution a leading environmental cause of cancer deaths. Available online:https://www.iarc.who.int/news-events/iarc-outdoor-air-pollution-a-leading-environmental-cause-of-cancer-deaths/. [accessed on 14.01.2021]
- 7.Pope C A, Burnett RT 3rd, Thurston G D, Thun M J, Calle E E et al. (2004) Cardiovascular mortality and long-term exposure to particulate air pollution: epidemiological evidence of general pathophysiological pathways of disease.Circulation.109(1):. 71-7.
- 8.Neuberger M, Moshammer H, Rabczenko D. (2013) Acute and subacute effects of urban air pollution on cardiopulmonary emergencies and mortality: time series studies in Austrian cities.International journal of environmental research and public health.10(10):. 4728-4751.
- 9.Wilson R, Spengler J D.Mallilnckrodt Research Professor of Physics Richard Wilson MDMS. (1996)Particles in Our Air: Concentrations and Health Effects. , Massachusetts 172-179.
- 10.Pletz H, Neuberger M. (2011) No Borders for Tobacco Smoke. in Hospitality Venues in Vienna.Atmosphere.2(2): 171-181.
- 11.Wiesner S C. Medical University of Vienna (2020) Die Feinstaubbelastung in der Wiener Gastronomie, gemessen als PM1, PM2,5 und PM10 und ihre gesundheitliche Bedeutung. Diploma Thesis. Available online:https://repositorium.meduniwien.ac.at/obvumwhs/content/titleinfo/5099665 , Vienna, Austria. Approved
- 12.Raab M. Medical University of Vienna (2020) Ultrafeinstaubbelastung in der Wiener Gastronomie vor Einführung des generellen Rauchverbots. Diploma thesis. Available online:https://repositorium.meduniwien.ac.at/obvumwhs/content/titleinfo/5166049 , Vienna, Austria. Approved
- 13.Grenz- Ziel- und Schwellenwerte.. Available online:https://www.umweltbundesamt.at/umweltthemen/luft/daten-luft/luft-grenzwerte. [accessed on 14.01.2021]
- 14.Austrian Federal Law. (2008) Bundesgesetz, mit dem das Tabakgesetz, das Allgemeine Sozialversicherungsgesetz, das Gewerbliche Sozialversicherungsgesetz und das Bauern-Sozialversicherungsgesetz geändert werden. Available online:https://www.parlament.gv.at/PAKT/VHG/XXIII/I/I_00610/fnameorig_111786.html. [accessed on 14.01.2021].
- 15.Austrian Federal Law 2019. Bundesgesetz über das Herstellen und Inverkehrbringen von Tabakerzeugnissen und verwandten Erzeugnissen sowie die Werbung für Tabakerzeugnisse und verwandte Erzeugnisse und den Nichtraucherinnen- bzw. Nichtraucherschutz (Tabak- und Nichtraucherinnen- bzw. Nichtraucherschutzgesetz – TNRSG). Available online:https://www.ris.bka.gv.at/GeltendeFassung.wxe?Abfrage=Bundesnormen&Gesetzesnummer=10010907. [accessed on 14.01.2021].
- 16.Burkart J, Steiner G, Reischl G, Moshammer H, Neuberger M et al. (2010) Characterizing the performance of two optical particle counters (Grimm OPC1.108 and OPC1.109) under urban aerosol conditions.Journal of Aerosol Science.41(10):. 953-962.
- 17.Aerosol GRIMM.Technik GmbH & Co. KG Portable Laser Aerosolspectrometer and Dust Monitor Model 1.108/1.109. Available online:https://www.wmo-gaw-wcc-aerosol-physics.org/files/opc-grimm-model--1.108-and-1.109.pdf. [accessed on 14.01.2021].
- 18.Fierz M, Houle C, Steigmeier P, Burtscher H. (2011) Design, Calibration, and Field Performance of a Miniature Diffusion Size Classifier.Aerosol Science and Technology.45(1):. 1-10.
- 19.Meier R, Clark K, Riediker M. (2013) Comparative Testing of a Miniature Diffusion Size Classifier to Assess Airborne Ultrafine Particles Under Field Conditions.Aerosol Science and Technology.47(1):. 22-28.
- 21.Bolte G, Heitmann D, Kiranoglu M. (2008) Exposure to environmental tobacco smoke in German restaurants, pubs and discotheques. , Journal of Exposure Science & Environmental Epidemiology 18(3), 262-271.
Cited by (1)
This article has been cited by 1 scholarly work according to: