
SARS-Cov-2 Viral Kinetics in Mild COVID-19 Patients Treated with Chloroquine Regimens or Standard of Care
Abstract
This study measures the impact of chloroquine (CQ) therapy in reducing SARS-CoV-2 viral load in infected individuals and hence its transmissibility by describing changes in nasopharyngeal SARS-CoV-2 RNA kinetics in patients receiving standard of care (SOC) or CQ +/- ritonavir-boosted lopinavir (LPV/r). The nasopharyngeal (NP) samples were collected from mild COVID-19 patients admitted at Bamrasnaradura Infectious Diseases Institute between March and April of 2020. These patients either received SOC, or a high dose of CQ with loading dose, or high dose of CQ plus LPV/r. The samples were tested at AFRIMS using a quantitative RT-PCR assay. Levels of CQ in the plasma were measured 6 days post initiation of their treatment. In some instances, viral isolation was attempted to determine SARS-CoV-2 viability. Analyses of the clinical outcomes showed that CQ +/- lopinavir did not contribute significantly to decreasing the number of days with detected SARS-CoV-2 RNA. Viral NP GEs declined faster in the CQ group, but benefits diminished rapidly with delays in treatment initiation.
Funding
Global Emerging Infections Surveillance, Armed Forces Health Surveillance Branch (GEIS-AFHSB) for all research-related activities at the AFRIMS
Author Contributions
Academic Editor: Raul Isea, Fundación Instituto de Estudios Avanzados - IDEA, Hoyo de la Puerta, Baruta.
Checked for plagiarism: Yes
Review by: Single-blind
Copyright © 2021 Krittaecho Siripassorn, et al.
 This is an open-access article distributed under the terms of the Creative Commons Attribution License, which permits unrestricted use, distribution, and reproduction in any medium, provided the original author and source are credited.
Competing interests
The authors have declared that no competing interests exist.
Citation:
Introduction
The COVID-19 pandemic continues to spread rapidly, infecting over 180 millions people and causing over 4 million deaths around the world. Several COVID-19 vaccines with Emergency Use Authorizations (EUA) in North America, Europe or Asia 1 are widely used in several countries. Nonetheless, COVID-19 infections are expected to cause significant morbidity and economic restrictions in the future. Incomplete protection and the identification of new immunity-evading SARS-CoV-2 variants underscore the need for safe and effective therapeutics. As of April, 2021, the US CDC has reported at least 10,262 infected COVID-19 cases in people vaccinated against SARS-CoV-2 in the USA 2.
Current medication guidelines recommend the use of remdesivir, an antiviral which was shown to reduce the virus in vitro 3 and reduce morbidity and mortality in COVID-19 patients with pneumonia 4, 5, in hospitalized patients but not in outpatients 6. Chloroquine (CQ), hydroxychloroquine (HCQ), and ritonavir-boosted lopinavir (LPV/r) have shown in vitro inhibition of SARS-CoV-2 3, 7. CQ and HCQ obtained a US FDA EUA in March of 2020, but this was later revoked due to lack of supporting clinical data 8, 9, 10, 11, 12 and toxicity risks. Current international guidelines recommend limiting their use to clinical trials 6.
It is not clear; however, whether effective antivirals can significantly reduce SARS-CoV-2 transmission. It is estimated that 25-69% of all transmissions occur during presymptomatic periods 13, whether due to lack of self-quarantine and despite a relatively short period of virus shedding 14.
Among symptomatic and asymptomatic infections, SARS-CoV-2 RNA detection in nasopharyngeal samples (a marker for viral shedding) can last up to a month or longer 14,15. Viral RNA remains detectable in recovered patients for prolonged periods of time 15, 16, 17. The best measure of viral transmissibility comes from studies measuring productive replication of SARS-CoV-2 from symptomatic COVID-19 cases, including mild cases, which are most symptomatic cases 18. These studies show that transmission potential peaks around 7 days-post symptoms onset (pso), or longer 19,20, and declines soon after 15, 21, 22, 23. Shortening the infectious period by 0.5 days in 25% of symptomatic patients 24 reduces SARS-CoV-2 basic reproductive rate, R0, averting 1.5 million COVID-19 cases and 37,992 hospitalizations. Given the association between SARS-CoV-2 viral shedding and transmissibility, assessing the suitability of COVID-19 therapeutics should not be limited to patient clinical outcomes only but also to their impact on R0. Studies have shown that CQ and HCQ can reduce viral replication and shedding. Gautret et al suggests that, among mild and asymptomatic COVID-19 cases, HCQ alone significantly reduces nasopharyngeal SARS-CoV-2 as fast as 3 days after treatment 25. Similarly, other reports suggest the CQ and derivatives may have similar effects 26.
This study measured changes in nasopharyngeal SARS-CoV-2 viremia in mild COVID-19 patients and tested whether administering CQ, alone or with LPV/r, accelerates the decline of nasopharyngeal SARS-CoV-2 RNA 27. Patients were diagnosed for COVID-19 during March and April of 2020 and hospitalized regardless of the severity of their disease. We compared the viral kinetics between individuals who received CQ +/- LPV/r against standard of care.
Material and Methods
Study Population
Mild COVID-19 patients were hospitalized during March and April 2020 at the Bamrasnaradura Infectious Diseases Institute (BIDI), Department of Disease Control, Ministry of Public Health, Thailand. Patients were hospitalized when diagnosed as having mild COVID-19 confirmed with SARS-CoV-2 RT-PCR as per local regulation. Patients received either SOC (medication for alleviating symptoms), or a high loading dose of CQ (ldCQ), or CQ without loading dose plus LPV/r (CQLPV). Subjects who developed pneumonia were discontinued from the cohort to receive appropriate treatment. The ldCQ group is defined as receiving a 1,000 mg of CQ as a loading dose, then 500 mg twice daily for 4 days, and followed by 375 mg twice daily for 9 days or until RT-PCR negative. Subjects in the CQLPV group received the same CQ dosing schedule and a standard dose of LPV/r. Nasopharyngeal swabs were collected from the patients on the date of admission and every 2-3 days during hospitalization. A blood sample was collected from patients in the ldCQ and CQLPV groups 6 days after initiation of CQ treatment to verify the presence of physiological levels of CQ. We extracted baseline demographic data, clinical presentation and treatment outcome from medical records, when available. Nasopharyngeal swabs and blood samples were kept at -80C at BIDI and thawed once before sending to the Armed Forces Research Institute of Medical Sciences (AFRIMS) for further laboratory analyses, and a second time if viral isolation was necessary. All specimens were coded and anonymized prior to shipping.
Diagnosis of SARS-CoV-2 RNA by Reverse-Transcription Polymerase Chain Reaction (RT-PCR)
Patients admission and discharge were at least dependent on a qualitative SARS-CoV-2 real-time RT-PCR test done at BIDI. Nasopharyngeal specimens were tested with either novel CoV 2019 real-time PCR (Jiangsu Bioperfectus Technologies, Taizhou, China) or real-time fluorescent RT-PCR (BGI technology, Shenzhen, China) for patients admitted on 31 Mar 2020, or earlier. Patients admitted after March 31, 2020 were tested with the Cobas SARS-CoV-2 qualitative assay using cobas 6800 systems (Roche Molecular Systems, Basel, Switzerland).
Quantification of SARS-CoV-2 Viral Load
Quantitative real-time RT-PCR to measure SARS-CoV-2 genome equivalents (GE) was performed at the Department of Virology, AFRIMS, Bangkok, Thailand. The assay was modified from the US-CDC method, targeting the N gene (Lu et al., 2020). Briefly, three separate reactions were carried out for each extracted RNA sample, two for detection of SARS CoV-2 N1 and N2 targets, and one for human RNase P gene (RP) target using SuperScript III Platinum One-Step Quantitative RT-PCR System (Invitrogen, USA) and 2019-nCoV CDC qPCR RUO kit Integrated DNA Technologies (IDT) USA. Human RP gene detection was used as extraction control. Each 25-µl reaction contained 12.5 µl of 2x Reaction Buffer containing 0.4 mM of each dNTP and 6 mM MgSO4, 1.5 µl of combined primer/probe mix for N1, N2, or RP (2019-nCoV CDC qPCR RUO kit), 0.5 µl of RNaseOUT (10 U/µl, Invitrogen, USA), 0.5 µl of 1:10 diluted ROX Reference Dye, 0.5 µl of SuperScript III RT/Platinum Taq, 4.5 µl of nuclease-free water, and 5 µl of extracted RNA sample. The single step RT-PCR consisting of a 30-min RT step at 50oC, 2 min of Taq inhibitor inactivation at 95oC, followed by 45 cycles of PCR at 95oC for 15 sec and 55oC for 30 sec was performed on an Applied Biosystems 7500 Fast Real-time PCR Instrument (Thermo Fisher Scientific, USA). The SARS-CoV-2 GE per sample was derived from standard curves of serial dilutions of in vitro SARS-CoV-2 RNA transcripts (IVTs).
SARS-CoV-2 Isolation
SARS-CoV-2 isolation was done in a cell culture system at AFRIMS biosafety level 3 laboratory. The selected nasopharyngeal specimens were either specimens that were positive after a period of undetectable quantitative RT-PCR result, or specimens with at least a 2 log10 viral load increase from the previous one. Virus isolation was performed using Vero E6 (monkey kidney epithelial cells) and A549 (human lung epithelial cells) cell lines with Eagle’s minimal essential medium (EMEM) containing 2-5% heat inactivated fetal bovine serum, 1% L-glutamine, 1% penicillin/streptomycin, 40 µg/ml gentamicin and 0.25 µg/ml fungizone. Cytopathic effect (CPE) was observed daily before harvesting or sub-culturing for 3 passages. Cell culture supernatant was harvested once the CPE was observed or day 5 at latest and tested using SARS-CoV-2 RT-PCR for confirmation.
Plasma Levels of Chloroquine, Desethylchlroqione and Hydroxychloroquine
Plasma levels of CQ were measured on day 6 post initiation of CQ treatment. Concentrations of CQ and desethyl-CQ were measured by Waters Acquity UPLC™ equipped with Xevo® G2-XS QToF (Waters Crop., MS, USA). 100 µl of plasma samples were extracted by adding 200 µl of iced-cold acetonitrile:methanol (25:75), incubated under BSC for 30 min, then 1-min vortexed and centrifuged at 10,000 rpm for 10 min. The supernatant was filtered through PTFE and transferred to UPLC vial. Chromatographic separation was performed on a Waters ACQUITY UPLC BEH C18 column (50x2.1 mm, 1.7 µm particle size) with pre-column of the same material (5x2.1 mm, 1.7 µm particle size) at a flow rate of 0.40 ml/min. A gradient elution composed of A) 5mM ammonium acetate pH 4.5 in water and B) 5 mM ammonium acetate pH 4.5 in acetonitrile: methanol (50:50 v/v). The column temperature was set at 40°C and injection volume was 5 µl. Compounds were ionized in positive ion mode with electrospray ionization source. The multiple reaction monitoring (MRM) was used to monitor the mass transition (m/z) of 320.33à142.22, 292.28à114.18, 336.20à247.23 and 379.29à271.22 for chloroquine, desethyl chloroquine, hydroxyl chloroquine and mefloquine (as internal standard), respectively. The MassLynx™ Software (Waters Crop., MS, USA) was used to operate the instruments, integration and quantification.
Statistical Analysis
We assessed the effects of CQ treatments on the duration at which SARS-CoV-2 RNA remained detectable in the respiratory samples using Cox proportional-hazards model 28. The event of viral RNA dropping below detectable levels was assumed to be between the collection date of the last quantitative PCR (qPCR) positive sample and the subsequent negative sample. For the three cases with no qPCR positive samples, but eligible for the study because a sample was positive by qualitative PCR, we treated the observations as left censored. Available covariates in the dataset were included to adjust for confounding factors and were stepwise removed (highest p-values first) from the multivariate model until the likelihood ratio test which measures the significance of the model no longer improved. We examined the 95% confidence intervals (CI) of the coefficients of the CQ treatment variables to determine the directionality and significance of the effects as compared to SOC.
The effects of CQ treatments on the quantitative declines in GE were assessed by regressing log10GE on the CQ treatment variables. We included all variables in the dataset xi, days PSO (denoted t), as well as the interactions between these variables and days PSO xit, to adjust for time invariant and time dependent differences. Individual terms with the highest p-values were stepwise removed until the Akaike’s Information Criterion (AIC) no longer improved. We examined the estimated coefficients of the CQ treatment variables and their 95%CI to determine the directionality and significance of the effects.
Ethical Approval
The study was approved by the Institutional Review Board of Bamrasnaradura Infectious Diseases Institute (BIDI). The laboratory activities at AFRIMS was determined as the research not involving human subjects by the Human Subjects Protection Office, AFRIMS.
Results
Study Subject Features
Of the 51 patients in this study, 25 received SOC (Table 1, Figure 1), 9 received high dose CQ plus LPV/r (CQLPV) and 17 received high dose CQ with loading dose (ldCQ). Most subjects were of working age and healthy. There were 3 patients with comorbidities: one pregnancy and one hypertension in the SOC group and one hypertension (a 63 years, male who later developed pneumonia) in the ldCQ group (Table 1). Common clinical features at admission were fever (n =14, 27%), cough (n =30, 59%), nasal congestion (n =30, 59%), rhinorrhea (n =19, 37%), myalgia (n =19, 37%), sore throat (n=17, 33%), and diarrhea (n =3, 6%).
Figure 1.Study diagram and timing of study events by individual. Treatment received and criteria of discharge are as labelled.
Figure 1 shows the timelines of nasopharyngeal swabs for subjects in each group. Administration of ldCQ was sooner than CQLPV, 5 days versus 9 days PSO, respectively (Table 1). Median (interquartile range, IQR) duration of hospitalization was 12 (8 - 17) days. Three subjects were admitted for longer than 30 days, with the longest being hospitalized for 45 days. Of the 51 subjects, 39 (76%) were discharged after two consecutive negative RT-PCR results. The remaining 12 subjects (all in SOC) were discharged after resolution of symptoms and one negative PCR.
Table 1. Demographic features, clinical characteristics, results of treatment, and adverse events.| Available Data (n) | SOC a | ldCQ b | CQLPV c | p-value | |
| Total number (n) | 51 | 25 | 17 | 9 | |
| Demographic features | |||||
| Median age, years (IQR) | 51 | 33 (26-37) | 36 (26 – 54) | 29 (26-46) | NS |
| Male, n (%) | 51 | 14 (56%) | 8 (47%) | 5 | NS |
| Median body weight, kilograms (IQR) | 47 | 62 (51-67) | 58 (51 – 70) | 61 (44-73) | NS |
| Nationality: Thai, n (%) | 51 | 24 (96%) | 17 (100%) | 9 | NS |
| Underlying Diseases, n (%) | 51 | 2 (8%) | 1 (6%) | 0 | NS |
| Hypertension | 1 | 1 | |||
| Pregnancy | 1 | ||||
| Baseline Laboratory | |||||
| Median hematocrit, % | 49 | 42 (38-45) | 41 (39 – 45) | 43 (41-45) | NS |
| Median white blood cell count, 10-3 cell/dL (IQR) | 49 | 5.8 (4.1-7.6) | 5.6 (4.3 – 7.2) | 5.0 (4.8-6.9) | NS |
| Lymphopenia, n (%) | 49 | 8 (35%) | 5 (29%) | 3 (33%) | NS |
| Median Creatinine, mg/dL (IQR) | 34 | 0.7 (0.6-1.3) | 0.8 (0.6 – 1.2) | 0.96 (0.63-1.1) | NS |
| Median ALT, IU/L (IQR) | 32 | 16 (11-22) | 17 (12 – 29) | 20 (12-25) | NS |
| Clinical Characteristics | |||||
| Median duration from onset of symptoms to admission, days (IQR) | 51 | 5 (3-9) | 5 (3-6) | 8 (6-10) | NS |
| Documented Fever | 51 | 7 (28%) | 3 (18%) | 4 | NS |
| Results of treatment | |||||
| Median duration from onset of symptom to antivirals, days (IQR) | 26 | NA | 5 (4-8) | 9 (6-11) | NS |
| Median time to undetectable SAR-CoV2, days (95%IQR) | 51 | 14 (7-25) | 16 (5-35) | 18 (8-49) | NS |
| Treatment failure, n | 51 | 0 | 1 d | 0 | NS |
| Median CQ trough level, ng/dL (IQR) | 15 | NA | 626 (462-1165) | 480 (206-1836) | |
| Median dCQ trough level, ng/dL (IQR) | 15 | NA | 471 (312-784) | 228 (172-1427) | |
| Adverse events | |||||
| Nausea, n | 26 | NA | 4 | 7 | 0.001 |
| Vomiting, n | 26 | NA | 3 | 2 | NS |
| Diarrhea, n | 26 | NA | 0 | 2 | NS |
| Dizziness, n | 26 | NA | 2 | 0 | NS |
| Rash, n | 26 | NA | 0 | 2 e | NS |
| Any significant cardiovascular event, such as Syncope, Hypotension, n | 26 | NA | 0 | 0 | NS |
SARS-CoV-2 Viral Kinetics in SOC
Detectable RNA were highest early on and declined over time (Figure 2). Individuals discharged with differing criteria had similar viral shedding durations. In subjects discharged after two consecutive negative RT-PCR (2-PCR), the median number of days PSO with detectable RNA was 13 (95%IQR: 6.0, 54.5) with a long tail to the right driven by one individual (max: 60). This was comparable to the viral load kinetics in the subgroup discharged after only one negative PCR (1-PCR), 14 days (95%IQR: 10.3, 32.6). The univariate hazard ratio of RNA dropping below detectable levels, 2-PCR compared to 1-PCR, was indifferent from one (95%CI: 0.81 to 4.16, p=0.13). Generalized additive models of log10GE over time were close to linear in both groups (Figure 2) suggesting patterns of exponential decay in the kinetics. Regressing log10GE on days PSO found the rate of decline to be 9% each day for the 2-PCR group (95%CI: 4%, 12%) and 13% (95%CI: 9%, 16%) for the 1-PCR group.
Figure 2.Viral load quantity measured as genome equivalents (GE) over days post symptom onset in each group: standard of care (SOC), high loading dose of chloroquine (ldCQ), or chloroquine without loading dose plus ritonavir-boosted lopinavir (CQLPV).
Effects of CQ Regimens on Viral Load Kinetics
RNA remained detectable for a median of 18.0 days (95%IQR: 8.2, 49.4) in the CQLPV group and 16.0 days (95%IQR 5.0, 34.6) in the ldCQ group (Figure 1 and Table 1). These intervals overlapped with those observed in the SOC. We assessed the difference using a multivariate Cox-proportional hazard model to adjust for confounding factors. Following the stepwise removal of covariates, the hazard ratios suggested trending but not significant changes in viral shedding duration in the ldCQ (Figure 3). Adjusted for the shorter duration in individuals discharged with 2-PCR and presence of fever at enrollment, the chance of RNA remaining detectable in the ldCQ group was 1.88-times the SOC (95%CI: 0.95 to 3.72) while the chance was 0.50-times for CQLPV (95%CI: 0.23 to 1.09).
Figure 3.Proportion of individuals with detectable RNA over time predicted from Cox-proportional hazards model for individuals. Hazard ratios of RNA dropping below detectable levels with and without the adjustment are annotated. Adjusted hazard model was adjusted for fever at enrollment and discharged with two consecutive negative PCR.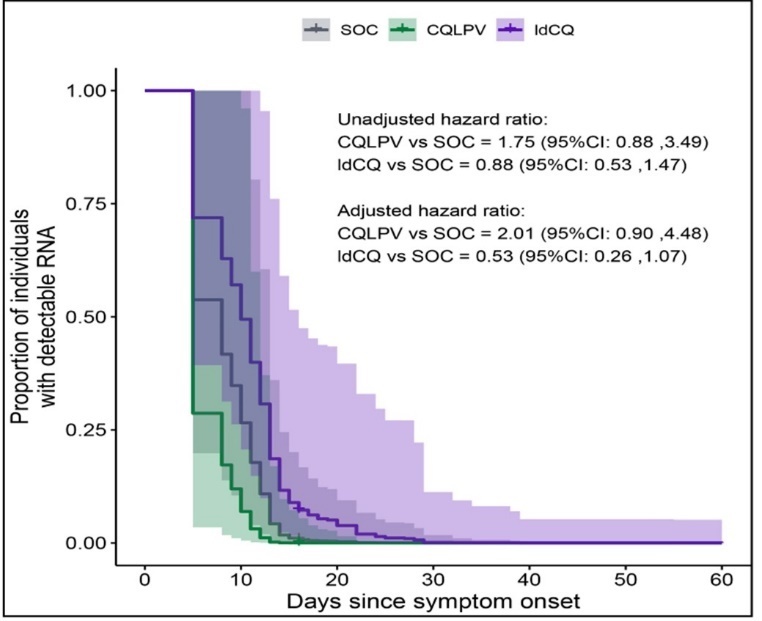
Figure 4.Multivariate log-linear regression of RNA genome equivalents. Effects of covariates on measured genome equivalents (GE) presented as multiples of their respective reference classes (categorical variables) or per unit of increase (continuous variables). Effects which accumulated over days post onset (PSO) were scaled to per 3 days for visual clarity. Whiskers are 95% confidence intervals of the point estimates. Results shown are from the model with the best Akaike’s Information Criterion (AIC) which explained 41% of the variance in logeGE.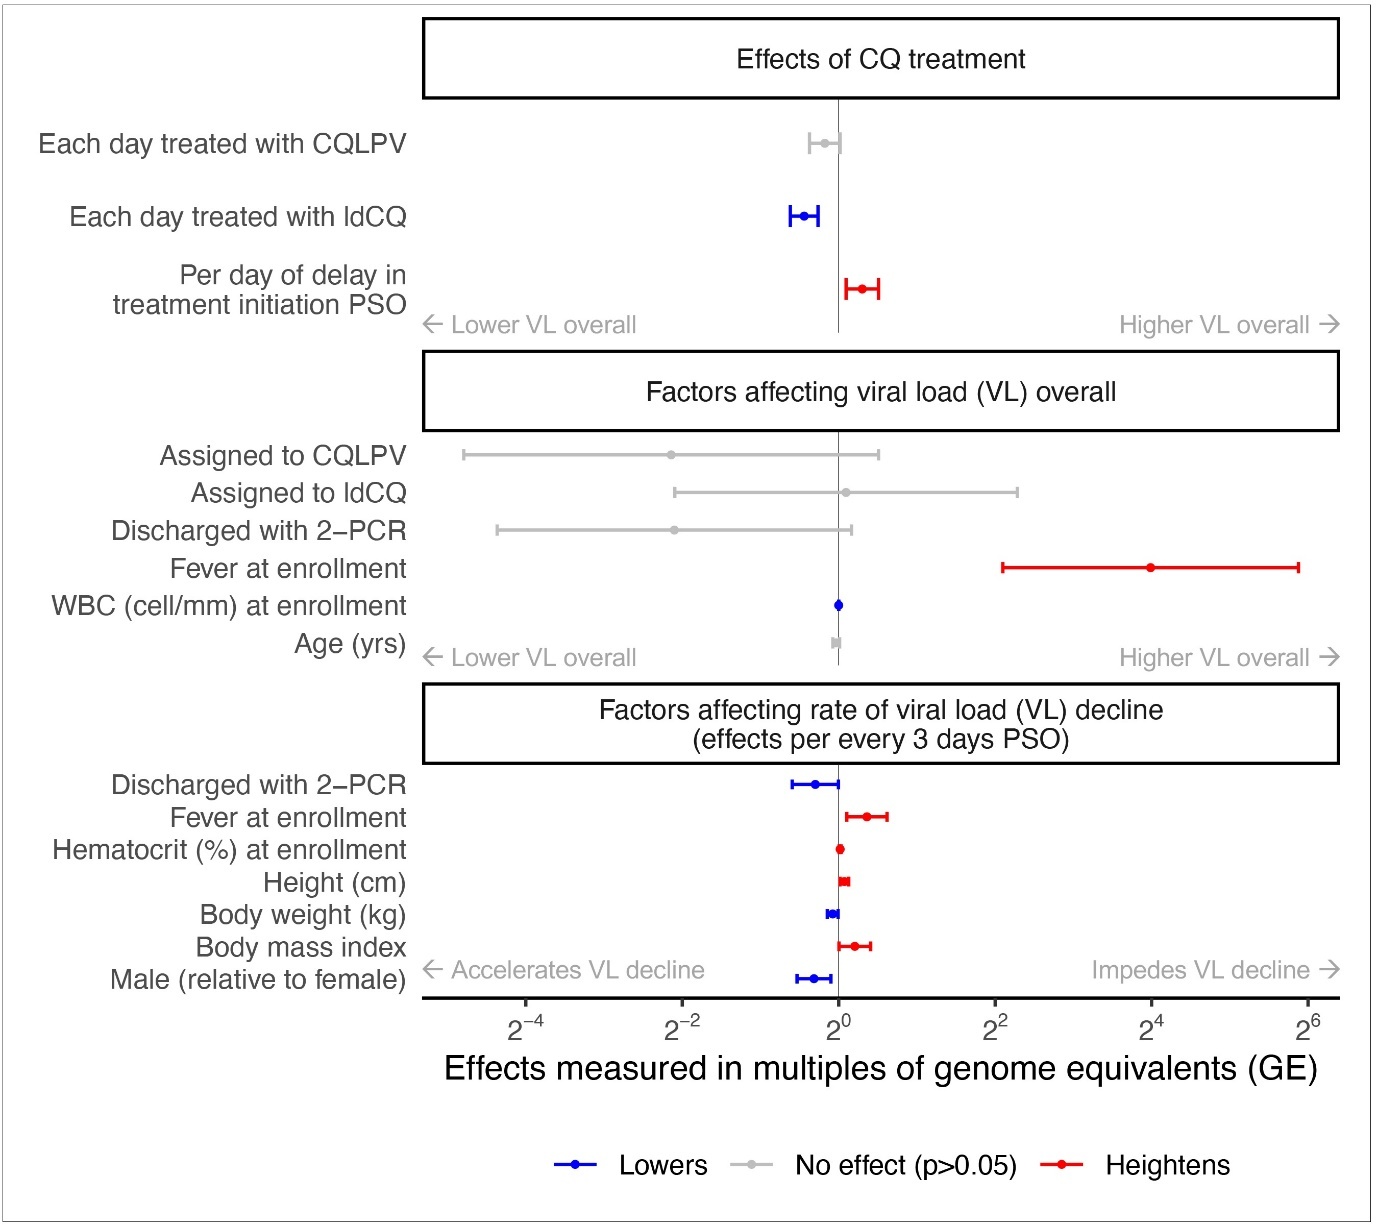
The relationship between receiving CQLPV and the quantified genome equivalents (GE) in the log-linear regression was congruent with the inference from detectable RNA durations (insignificant effects on GE decline, 95%CI: -2%, 23%), Figure 4. In contrast, each day of ldCQ treatment improved the GE decline by 26% (95%CI: 17%, 35%). Each day of delay in CQ administration, hindered the effects by 23% (95%CI: 6%, 43%). When treated with SOC, GE declined 77% (95%CI: 16%, 95%) each day corresponding to RNA levels dropping below 0.1% of the levels at symptom onset by 3 to 40 days PSO. These effects were adjusted for variables retained in the multivariate regression after stepwise removal including fever at enrollment and intrinsic characteristics of individuals. Individuals with fever at enrollment had 16-times the GE of those without (95%: 4.17, 60.36) and showed 9% less in decline each day (95%CI: 2%, 15%). Except for males exhibiting 7% more decline each day than females (95%CI: 2%, 12%), other variations that achieved statistical significance had marginal effects on the decline.
To ensure that CQ was present at therapeutic levels in the CQ treatment groups, we measured the plasma level CQ and its metabolite, desethyl-CQ (dCQ) (Table 1). Median trough levels of CQ in the ldCQ and CQLPV groups were 626 ng/dL and 480 ng/dL, respectively. Of the 15 subjects who had serum CQ measurements, twelve (80%) had levels above 360 ng/dL, which are deemed adequate as per previous pharmacokinetic modelling study 29. There was no difference in viral kinetics between subjects who had adequate CQ level and those who did not.
Fitness and Transmissibility of Resurging Viral Loads
To verify that the detected genome equivalents following viral load troughs were replication competent, we cultured specimens collected at the troughs and the subsequent resurgences.
Of 49 selected specimens, we successfully isolated SARS-CoV-2 from four samples acquired from three subjects between 12 to 24 days PSO. PCR’s cycle threshold (Ct) of these isolates collected on 12, 23, 18, and 24 days PSO were 26, 27, 36 and 36, respectively.
Adverse Events in Subjects Treated with CQ
Adverse events in each treatment group are shown in Table 1. Common adverse events were nausea, and vomiting. Medications to relieve or prevent adverse events were available to all patients. The events were generally mild to moderate as per the DAIDS grading table 30, except for three subjects, which led to the termination of CQ treatments. Two subjects in the CQLPV group had grade 3 generalized skin rash after receiving antivirals starting for at least 10 days. Their skin biopsy showed acute generalized exanthematous pustulosis (AGEP). Lymphocyte transformation tests were negative with CQ and LPV/r. One subject in the ldCQ group had grade 2 nausea and vomiting. All three subjects were negative for SARS-CoV-2 by PCR prior to termination.
Discussion
This study describes SARS-CoV-2 viral kinetics in mild COVID-19 patients treated with SOC or with CQ in the presence or absence of LPV/r. Early in vitro data had identified CQ and LPV/r as candidates therapeutics for the treatment of COVID-19, capable of inhibiting SARS-CoV-2 infection and replication 3, 7, 31, most clinical studies have not shown any clinical benefit 8, 9, 10, 11, 12. Nonetheless, few clinical data support the use of CQ in COVID-19 as an inhibitor of viral replication in COVID-19 patients 25,26. Here we show that days to undetectable RNA in the IdCQ or CQLPV groups were not significantly different from SOC (Figure 3) but differences in nasopharyngeal viral load exist (Figure 4). The viral load peaked around symptom onset, or within one week post, after which they declined significantly. Median duration of viral shedding in all groups was about two weeks. Our analyses identified two sets of factors affecting the viral kinetics, ones that affected the viral load overall and ones that affected the rate of decline. While most characteristics of individuals slightly altered the rate of decline, presence of fever was associated with both higher RNA levels overall and slower declines. Duration of viral shedding seemed to be independent of comorbidities status, of which only a very small number (n=3) was included. When adjusted for these, ldCQ tended to accelerate the decline by 26% (95%CI: 17%, 35%) per each day administered, while CQLPV did not have any effect, despite CQ concentrations in the serum of patients reaching therapeutic levels (Table 1).
We tested SARS-CoV-2 fitness and transmissibility. Of 49 selected specimens, we successfully isolated SARS-CoV-2 from only 4, all collected between 12 to 24 days after onset of symptoms. Despite the small number, these results demonstrate that SARS-CoV-2 remains potentially transmissible in COVID-19 patients after prolonged periods without symptoms. This is relevant as infectivity is mainly associated with presymptomatic and symptomatic periods. Observational and cross-sectional studies have shown that productive viral shedding can occur 7-9 days post onset of symptoms in mild to moderate COVID-19 cases 15, 21, 22. In severe or immunocompromised cases, viral shedding can occur even after significantly longer periods 19, 20, 32. Our results suggest closer attention should be given to mild COVID-19 patients, even weeks after symptoms recovery. Strict mask wearing and social distancing, among others, should be considered after patients discontinue isolation periods, in contrast to, for example, the February, 2021 US CDC recommendation to discontinue isolation of COVID-19 patients 10 days from onset of symptom if they have recovered from their symptoms 33. Moreover, reports of viral load in patients infected with the current variant of concern, Delta, being a 1000-fold higher compared to strains circulating in early 2020 34 warrants further investigations as to whether the infectious period has changed which would affect the period of case isolation needed to truncate the transmission chains.
The physiologically-based pharmacokinetic (PBPK) modelling suggested that administered CQ doses in the ldCQ and CQLPV groups were sufficient to acheive CQ level (Ctrough) above effective concentration (i.e. EC50) 29. The Ctrough in both groups were generally higher than EC50 (i.e. >360 ng/dL) (Table 1). Adverse events were found in three subjects, whose treatments were stopped due to rash or gastrointestinal side effects (Table 1).
Our study shows that viral kinetics in mild COVID-19 patients generally peak within one week after onset of symptoms. We were unable to observe the log phase of the virus, since nearly half of the initial specimens were collected from the subjects at least 5 days PSO. Median duration from onset of symptoms to last detectable viral load was 14 days (maximum of 53 days). Based on our findings, the level of viral shedding could be reduced with ldCQ, but the benefit could be quickly hindered with a few days of treatment delay. Similar patterns have been reported for other antivirals where benefits were only seen if given within 5 days PSO 35.
This study had some limitations. The relatively small number of cases we were able to access limited the granularity of our SARS-CoV-2 viremia data; while we found no significant differences between CQLPV and SOC, it is possible that a larger number of cases could have further resolved what appear to be diverging viral load trends among the groups (Figure 4). Additionally, as is the case with similar studies, the inherently inconsistent nasopharyngeal swabbing adds an element of assay variability. Finally, this was an observation study based on outbreak response and we relied on often inconsistent clinical data and specimens. For example, nasopharyngeal specimens were inconsistently collected from 8 of the cases studied and ECGs were not available to monitor QT prolongation arising from ldCQ or CQLPV. All these limitations should be considered when interpreting the data presented here.
Disclaimer
Material has been reviewed by the Walter Reed Army Institute of Research. There is no objection to its presentation and/or publication. The opinions or assertions contained herein are the private views of the author, and are not to be construed as official, or as reflecting true views of the Department of the Army or the Department of Defense.
Acknowledgements
All research-related activities at the AFRIMS were funded by the Global Emerging Infections Surveillance, Armed Forces Health Surveillance Branch (GEIS-AFHSB). We appreciated study coordinators, doctors, nurses and staff at the Bamrasnaradura Infectious Diseases Institute, who provided care to their patients and collected the specimens tested here. These include (but not limited to): Drs. Surasak Wiboonchutikul, Wannart (Amornnimit) Pongpirul, Lantharita Charoepong, Patama Suttha, Weerawat Manosuthi and Wisit Prasithsirikul; research coordinators Supeda Thongyen, Anongnuch Sujirarat and Phanasa Wongsasiriphat; medical technologist Pawita Suwanvattana and Unchana Thawornwan. We also thanked Juntra Karbwang MD, PhD and Teerachat Saeheng for their valuable advice to protocol development, especially the appropriate time to evaluate CQ level.
References
- 1. (2021) World Health Organization. Covid-19 Vaccines within WHO EUL/PQ evaluation process Retrieved onlineApril12,2021from:https://www.who.int/teams/regulation-prequalification/eul/covid-19 .
- 2. (2021) CDC COVID-19 Vaccine Breakthrough Case Investigations Team (2021) COVID-19 Vaccine Breakthrough Infections Reported to CDC - United States. , MMWR Morb Mortal Wkly Rep 70(21), 792-793.
- 3.Wang M, Cao R, Zhang L, Yang X, Liu J et al. (2020) Remdesivir and chloroquine effectively inhibit the recently emerged novel coronavirus (2019-nCoV) in vitro. , Cell Res 30(3), 269-271.
- 4.RECOVERY Collaborative Group, Horby P, Lim W S, Emberson J R, Mafham M et al. (2020) . Dexamethasone in Hospitalized Patients with Covid-19 - Preliminary Report N Engl J Med, https://doi.org/10.1056/NEJMoa2021436 .
- 5.Beigel J H, Tomashek K M, Dodd L E, Mehta A K, Zingman B S et al. (2020) Remdesivir for the Treatment of Covid-19 -. ACTT-1 Study Group Members , Final Report N Engl J Med.
- 6. (2020) . National Institutes of Health Coronavirus Disease 2019 (COVID-19) Treatment Guidelines Retrieved online from: https://www.covid19treatmentguidelines.nih.gov/ .
- 7.Wu C-Y, Jan J-T, Ma S-H, Kuo C-J, Juan H-F et al. (2004) Small molecules targeting severe acute respiratory syndrome human coronavirus Proc Natl Acad Sci. , U S A 101(27), 10012-10017.
- 8.RECOVERY Collaborative Group, Horby P, Mafham M, Linsell L, Bell J L et al. (2020) Effect of Hydroxychloroquine in Hospitalized Patients with. , Covid-19 N Engl J Med 383(21), 2030-2040.
- 9.Consortium Solidarity WHO Trial, Pan H, Peto R, Henao-Restrepo A-M, Preziosi M-P et al. (2020) Repurposed Antiviral Drugs for Covid-19 -. , Interim WHO Solidarity Trial Results N Engl J Med
- 10.Geleris J, Sun Y, Platt J, Zucker J, Baldwin M et al.. Schluger NW (2020) Observational Study of Hydroxychloroquine in Hospitalized Patients with Covid-19 , N Engl J Med 382(25), 2411-2418.
- 11.Cao B, Wang Y, Wen D, Liu W, Wang J et al. (2020) A Trial of Lopinavir-Ritonavir in Adults Hospitalized with Severe Covid-19. , N Engl J Med 382(19), 1787-1799.
- 12.RECOVERY Collaborative Group (2020) Lopinavir-ritonavir in patients admitted to hospital with COVID-19 (RECOVERY): a randomised, controlled, open-label, platform trial Lancet.
- 13.He X, EHY Lau, Wu P, Deng X, Wang J et al. (2020) Temporal dynamics in viral shedding and transmissibility of COVID-19. , Nat Med 26(5), 672-675.
- 14.Li W, Su Y-Y, Zhi S-S, Huang J, Zhuang C-L et al. (2020) Virus shedding dynamics in asymptomatic and mildly symptomatic patients infected with SARS-CoV-2 Clin Microbiol Infect. 26(11), 1556-1556.
- 15.Wölfel R, Corman V M, Guggemos W, Seilmaier M, Zange S et al. (2020) Virological assessment of hospitalized patients with COVID-2019. , Nature 581(7809), 465-469.
- 16.Li J, Wei X, Tian W, Zou J, Wang Y et al. (2020) Clinical features of discharged COVID-19 patients with an extended SARS-CoV-2 RNA positive signal in respiratory samples Virus Res. 286, 198047.
- 17.Landi F, Carfì A, Benvenuto F, Brandi V, Ciciarello F et al. (2020) Predictive Factors for a New Positive Nasopharyngeal Swab Among Patients Recovered From COVID-19 Am J Prev Med. Gemelli Against COVID-19 Post-Acute Care Team , https://doi.org/10.1016/j.amepre.2020.08.014 .
- 18.Wu Z, McGoogan J M. (2020) Characteristics of and Important Lessons From the Coronavirus Disease2019(COVID-19)Outbreak in China: Summary of a Report. of 72314 Cases From the Chinese Center for Disease Control and Prevention JAMA 323(13), 1239-1242.
- 19.Liu W-D, Chang S-Y, Wang J-T, Tsai M-J, Hung C-C et al. (2020) Prolonged virus shedding even after seroconversion in a patient with COVID-19. , J Infect 81(2), 318-356.
- 20.Choi B, Choudhary M C, Regan J, Sparks J A, Padera R F et al. (2020) Persistence and Evolution of SARS-CoV-2 in an Immunocompromised Host. , N Engl J Med
- 21.Bullard J, Dust K, Funk D, Strong J E, Alexander D et al. (2020) Predicting infectious SARS-CoV-2 from diagnostic samples Clin Infect Dis. , https://doi.org/10.1093/cid/ciaa638
- 22.Arons M M, Hatfield K M, Reddy S C, Kimball A, James A et al. (2020) Presymptomatic SARS-CoV-2 Infections and Transmission in a Skilled Nursing Facility. Public Health–Seattle and King County and CDC COVID-19 Investigation Team , N Engl J Med 382(22), 2081-2090.
- 23.Walsh K A, Jordan K, Clyne B, Rohde D, Drummond L et al. (2020) SARS-CoV-2 detection, viral load and infectivity over the course of an infection. , J Infect 81(3), 357-371.
- 24.Lee B Y, Bartsch S M, Ferguson M C, Wedlock P T, O’Shea K J et al. (2021) The value of decreasing the duration of the infectious period of severe acute respiratory syndrome coronavirus 2 (SARS-CoV-2) infection PLoS. , Comput Biol 17(1), 1008470.
- 25.Gautret P, Lagier J-C, Parola P, Hoang V T, Meddeb L et al. (2020) Hydroxychloroquine and azithromycin as a treatment of COVID-19: results of an open-label non-randomized clinical trial. , Int J Antimicrob Agents 56(1), 105949.
- 26.Chen P-F, Yu X-X, Liu Y-P, Ren D, Shen M et al. (2020) Virus load and virus shedding of SARS-CoV-2 and their impact on patient outcomes World. , J Clin Cases 8(24), 6252-6263.
- 27.Walsh K A, Spillane S, Comber L, Cardwell K, Harrington P et al. (2020) The duration of infectiousness of individuals infected with SARS-CoV-2. , J Infect
- 28.2Cox D R. (1972) Regression Models and Life-Tables. , J R Stat Soc Series B Stat Methodol 34(2), 187-220.
- 29.Saeheng T, Bangchang K N, Rajoli R, Siccardi M, Karbwang J.Dosage prediction of chloroquine and ritonavir-boosted lopinavir for COVID-19 treatment: A physiologically-based pharmacokinetic (PBPK). modelling, https://doi.org/10.22541/au.158274659.94868170
- 30.of Health USD, Services H. (2018) National Institute of Allergy and Infectious Diseases, Division of AIDS. Division of AIDS (DAIDS) table for grading the severity of adult and pediatric adverse events, corrected version. 2-1.
- 31.Vincent M J, Bergeron E, Benjannet S, Erickson B R, Rollin P E et al. (2005) Chloroquine is a potent inhibitor of SARS coronavirus infection and spread. , Virol J 2, 69.
- 32.van Kampen JJA, DAMC van de Vijver, PLA Fraaij, Haagmans B L, Lamers M M et al. (2020) Shedding of infectious virus in hospitalized patients with coronavirus disease-2019 (COVID-19): duration and key determinants Infectious Diseases (except HIV/AIDS) . van der Eijk AA .
- 33.CDC. (2021) Discontinuation of Isolation for Persons with. COVID-19 Not in Healthcare Settings Retrieved onlineApril12,2021from:https://www.cdc.gov/coronavirus/2019-ncov/hcp/disposition-in-home-patients.html .