
Assessment of Sex from the Anthropometric Measurements of the Foot in Ogbomosho North Local Government Area
Abstract
The aim of this physical anthropometric study is to determine sex by foot measurements. Dismembered human remains are frequently found in cases of mass disasters and criminal mutilation. It is therefore of interest to use foot dimensions for the determination of sex (gender) of an individual in order to assist in establishing personal identity. Another application of anthropometrical measurement is in ergonomics which is the design of working space and the development of industrialized products such as furnishing, cars, tools, shoe designing etc.
500 adult subjects(250 males, 250 females)aged 18-50 years without any foot disability within Ogbomosho North Local Government, Oyo State were randomly selected for the study. The males had an average foot length about 1cm greater than females and foot breadth in males was about 1cm greater as compared to females. Difference in foot length and foot breadth in males and females of the population was highly significant. With the statistical analysis, any foot with length lesser than 26cm and breadth lesser than 11cm can be suggested to be that of a female while any foot with length greater than 26cm and breadth greater than 11cm can be suggested to be that of a male. Therefore, 26cm can be taken as the cut-off point for foot length and 11cm as the cut-off point for foot breadth in this locality.
Author Contributions
Academic Editor: Jonas A, Rudn University, Institute of Medicine, Department of Human Anatomy, Russia.
Checked for plagiarism: Yes
Review by: Single-blind
Copyright © 2020 Akinloye S. Ayobami, et al.
 This is an open-access article distributed under the terms of the Creative Commons Attribution License, which permits unrestricted use, distribution, and reproduction in any medium, provided the original author and source are credited.
Competing interests
The authors have declared that no competing interests exist.
Citation:
Introduction
Anthropometry is the measurement of the body dimensions such as the length, the width, and the height for the purpose of understanding human physical variations and plays an important role in ergonomics, clothing designing, prosthetics, plastic surgery, and industrial designs, where statistical data about the distribution of the body dimensions in the population are used to optimize product. Appropriate use of anthropometry in design may improve well-being, health, comfort, and safety 1, 2. Identification is often required in medico-legal practice. The problem mainly arises when the body is recovered in advanced stage of decomposition, mutilated state and skeletonized state. Sometimes, fragments of soft tissues are found disposed off in the open, in ditches, or rubbish dumps and this material is bought to forensic pathologist for examination. Over the last few decades, studies have been largely conducted on human foot for both ergonomic shoe design and forensic purposes 3.
Anthropologists continue to use anthropometric data to study the differences between various groups of people, though they no longer do so with the goal of promoting racial superiority. Measuring people can also provide information about how humans are changing, with such measurements being used by people who develop prosthesis, clothing, furniture, and other consumer goods which are dependent on average user size. Measurements can include length and breadth measurements of various aspects of the body, ranging from overall height to individual fingers along with weights. Measurements are also taken to learn more about the inside of the body, such as density measurements 4.
Sex determination is a very vital part of the analysis of human remains. Lots of researches are going on for assessing stature, sex, race, etc. from anthropometric measurements of different parts of the body for identification purpose 4. In this study, an attempt was made to find out the correlation of foot measurements with the sex (male/female) among Ogbomosho north local government people.
Materials and Methods
Equipment Used for the Study
The equipments used are:
· Metallic measuring tape
· Foot platform
· Plastic ruler
Methodology
The study was conducted among the people of Ogbomosho north local government. 500 healthy subjects (250 males and 250 females) in the age bracket of 18-50 years were used. This is because most people attain their maximum growth at this age bracket, therefore their maximum foot length and breadth will be obtainable. The study was conducted in July 2013 among randomly selected volunteers from Sabo garage, Wazobia market, Orita naira area, Oke-anu area, Town Planning area, Stadium area, General area, Randa area, Papa Alajiki area, Star Parade Hotel area, Adiatu area and Atenda area of Ogbomosho north local government. Prior informed consent of the subjects for the study was done in English and Vernacular about the purpose of the study, equipment, measurement procedure and possible applications of data to be collected. None of the individuals that were asked to participate in the study was coerced in any way or provided with a reward for their involvement. All the subjects were barefooted at the time of recording the measurements. All the measurements for the study were taken with the subjects standing erect in an anatomical position. Subjects below 18 and above 50 years of age as well as those with apparent foot anomalies, inflammation, trauma, deformities and surgery (if any) were excluded because of their unsuitability for the study so as to get accurate result.
Measurements
Foot Length: The foot length was measured as a straight distance between the most posteriorly projecting point of the heel (pternion) and the most anteriorly projecting point on the head of the first or second toe (akropodion), whichever is longer, when the subject stood erect on flat surface. This measurement excluded any nail extending over the end of the toe 5.
Foot Breadth: The foot breadth was measured as a straight distance from the medial border of the head of first metatarsal to the lateral border of the head of the fifth metatarsal 5.

Measurements were confirmed twice before recording was done and they were taken in centimetres (cm).
Image
Data Analysis
The data was analysed using the Statistical Package for Social Sciences (SPSS, version 17.0). Descriptive statistics (mean, standard deviation) for each foot parameter; foot length, and foot breadth were computed within gender and age class, and mean values between male and female of the same age class were compared using Student’s t-test for independent samples. Significance was set at 5% (p<0.05) for both Group Statistics’ Independent Sample Tests and Tests of Between-Subjects Effects while 1% (p<0.01) was set as the significance level for the Correlation Test. The total measurement obtained for all the foot parameters measured were represented in complex bar charts to distinguish between male and female.
Results
The mean values of the foot parameters obtained were compared statistically using student t-test. The results obtained indicated a sexual dimorphism with significantly higher values of all the parameters in males compared to females. The foot parameters were represented in the tables (1 - 20) and (figure 1- 5). Below will be abbreviated thus;
Keywords
· Right foot length --- (RFL)
· Right foot breadth --- (RFB)
· Left foot length --- (LFL)
· Left foot breadth --- (LFB)
· Male --- (M)
· Female --- (F)
(Table 1, Table 2, Table 3, Table 4, Table 5, Table 6, Table 7, Table 8, Table 9, Table 10, Table 11, Table 12, Table 13, Table 14, Table 15, Table 16)
Table 1. Group statistics, p.value and significance table for all the results obtained within the age group of 18-21 (recorded in cm)| RFL (P = 0.000) | RFB (P = 0.000) | LFL (P = 0.000) | LFB (P = 0.001) | |
| Mean ± Sd | Mean ± Sd | Mean ± Sd | Mean ± Sd | |
| Male | 26.6161±1.38494 | 11.3032±1.13944 | 26.5842±1.41434 | 11.1452±1.01253 |
| Female | 25.0161±1.09151 | 10.3871±0.77147 | 24.8871±1.07788 | 10.3387±0.73470 |
| Male | Significant | Significant | Significant | Significant |
| Female | Significant | Significant | Significant | Significant |
| Sex | RFL (P = 0.000) | RFB (P = 0.000) | LFL (P = 0.000) | LFB (P = 0.002) |
| Mean ± Sd | Mean ± Sd | Mean ± Sd | Mean ± Sd | |
| Male | 27.0323±1.34744 | 11.3065±0.86292 | 27.0581±1.44794 | 11.2097±0.80389 |
| Female | 24.8161±1.30948 | 10.5323±0.75206 | 24.8968±1.30907 | 10.5484±0.79953 |
| Male | Significant | Significant | Significant | Significant |
| Female | Significant | Significant | Significant | Significant |
| Sex | RFL (P = 0.000) | RFB (P = 0.000) | LFL (P = 0.000) | LFB (P = 0.000) |
| Mean ± Sd | Mean ± Sd | Mean ± Sd | Mean ± Sd | |
| Male | 27.2097±1.52082 | 11.3065±1.01388 | 27.2903±1.43628 | 11.3065±1.03019 |
| Female | 25.1290±1.04057 | 10.3452±0.61092 | 25.0484±1.02758 | 10.3452±0.63762 |
| Male | Significant | Significant | Significant | Significant |
| Female | Significant | Significant | Significant | Significant |
| Sex | RFL (P = 0.000) | RFB (P = 0.000) | LFL (P = 0.000) | LFB (P = 0.000) |
| Mean ± Sd | Mean ± Sd | Mean ± Sd | Mean ± Sd | |
| Male | 26.9355±1.07037 | 11.0710±0.67042 | 26.9355±1.06256 | 11.0355±0.61294 |
| Female | 25.0000±1.19722 | 10.2097±0.84434 | 25.0323±1.20371 | 10.2742±0.85478 |
| Male | Significant | Significant | Significant | Significant |
| Female | Significant | Significant | Significant | Significant |
| Sex | RFL (P = 0.000) | RFB (P = 0.000) | LFL (P = 0.000) | LFB (P = 0.000) |
| Mean ± Sd | Mean ± Sd | Mean ± Sd | Mean ± Sd | |
| Male | 27.1355±1.34500 | 11.2903±0.58842 | 27.1194±1.35583 | 11.2742±0.56034 |
| Female | 25.2903±1.23676 | 10.3871±0.57314 | 25.2419±1.25081 | 10.3903±0.57117 |
| Male | Significant | Significant | Significant | Significant |
| Female | Significant | Significant | Significant | Significant |
| Sex | RFL (P = 0.000) | RFB (P = 0.000) | LFL (P = 0.000) | LFB (P = 0.000) |
| Mean ± Sd | Mean ± Sd | Mean ± Sd | Mean ± Sd | |
| Male | 26.9839±1.55179 | 11.6129±0.84370 | 27.0484±1.58301 | 11.5710±0.80175 |
| Female | 24.7742±1.05545 | 10.2419±0.66922 | 24.8065±1.09299 | 10.2323±0.66753 |
| Male | Significant | Significant | Significant | Significant |
| Female | Significant | Significant | Significant | Significant |
| Sex | RFL (P = 0.000) | RFB (P = 0.000) | LFL (P = 0.000) | LFB (P = 0.000) |
| Mean ± Sd | Mean ± Sd | Mean ± Sd | Mean ± Sd | |
| Male | 27.0677±1.49875 | 11.5258±0.91505 | 27.1065±1.54314 | 11.4806±0.90532 |
| Female | 25.2581±1.23066 | 10.3065±0.61478 | 25.2419±1.22387 | 10.2742±0.60331 |
| Male | Significant | Significant | Significant | Significant |
| Female | Significant | Significant | Significant | Significant |
| Sex | RFL (P = 0.000) | RFB (P = 0.000) | LFL (P = 0.000) | LFB (P = 0.000) |
| Mean ± Sd | Mean ± Sd | Mean ± Sd | Mean ± Sd | |
| Male | 26.7121±1.32895 | 11.1667±0.58184 | 26.8182±1.38529 | 11.1212±0.68500 |
| Female | 24.9697±1.40278 | 10.2030±0.69439 | 24.9091±1.43317 | 10.1636±0.65661 |
| Male | Significant | Significant | Significant | Significant |
| Female | Significant | Significant | Significant | Significant |
| Correlations | |||||
| RFL | RFB | LFL | LFB | ||
| RFL | Pearson Correlation | 1 | .589** | .989** | .561** |
| Sig. (2-tailed) | .000 | .000 | .000 | ||
| N | 62 | 62 | 62 | 62 | |
| RFB | Pearson Correlation | .589** | 1 | .605** | .961** |
| Sig. (2-tailed) | .000 | .000 | .000 | ||
| N | 62 | 62 | 62 | 62 | |
| LFL | Pearson Correlation | .989** | .605** | 1 | .574** |
| Sig. (2-tailed) | .000 | .000 | .000 | ||
| N | 62 | 62 | 62 | 62 | |
| LFB | Pearson Correlation | .561** | .961** | .574** | 1 |
| Sig. (2-tailed) | .000 | .000 | .000 | ||
| N | 62 | 62 | 62 | 62 | |
| Correlations | |||||
|---|---|---|---|---|---|
| RFL | RFB | LFL | LFB | ||
| RFL | Pearson Correlation | 1 | .622** | .984** | .639** |
| Sig. (2-tailed) | .000 | .000 | .000 | ||
| N | 62 | 62 | 62 | 62 | |
| RFB | Pearson Correlation | .622** | 1 | .612** | .935** |
| Sig. (2-tailed) | .000 | .000 | .000 | ||
| N | 62 | 62 | 62 | 62 | |
| LFL | Pearson Correlation | .984** | .612** | 1 | .644** |
| Sig. (2-tailed) | .000 | .000 | .000 | ||
| N | 62 | 62 | 62 | 62 | |
| LFB | Pearson Correlation | .639** | .935** | .644** | 1 |
| Sig. (2-tailed) | .000 | .000 | .000 | ||
| N | 62 | 62 | 62 | 62 | |
| Correlations | |||||
|---|---|---|---|---|---|
| RFL | RFB | LFL | LFB | ||
| RFL | Pearson Correlation | 1 | .563** | .988** | .606** |
| Sig. (2-tailed) | .000 | .000 | .000 | ||
| N | 62 | 62 | 62 | 62 | |
| RFB | Pearson Correlation | .563** | 1 | .586** | .978** |
| Sig. (2-tailed) | .000 | .000 | .000 | ||
| N | 62 | 62 | 62 | 62 | |
| LFL | Pearson Correlation | .988** | .586** | 1 | .624** |
| Sig. (2-tailed) | .000 | .000 | .000 | ||
| N | 62 | 62 | 62 | 62 | |
| LFB | Pearson Correlation | .606** | .978** | .624** | 1 |
| Sig. (2-tailed) | .000 | .000 | .000 | ||
| N | 62 | 62 | 62 | 62 | |
| Correlations | |||||
| RFL | RFB | LFL | LFB | ||
| RFL | Pearson Correlation | 1 | .710** | .985** | .729** |
| Sig. (2-tailed) | .000 | .000 | .000 | ||
| N | 62 | 62 | 62 | 62 | |
| RFB | Pearson Correlation | .710** | 1 | .712** | .956** |
| Sig. (2-tailed) | .000 | .000 | .000 | ||
| N | 62 | 62 | 62 | 62 | |
| LFL | Pearson Correlation | .985** | .712** | 1 | .729** |
| Sig. (2-tailed) | .000 | .000 | .000 | ||
| N | 62 | 62 | 62 | 62 | |
| LFB | Pearson Correlation | .729** | .956** | .729** | 1 |
| Sig. (2-tailed) | .000 | .000 | .000 | ||
| N | 62 | 62 | 62 | 62 | |
| Correlations | |||||
|---|---|---|---|---|---|
| RFL | RFB | LFL | LFB | ||
| RFL | Pearson Correlation | 1 | .708** | .976** | .670** |
| Sig. (2-tailed) | .000 | .000 | .000 | ||
| N | 62 | 62 | 62 | 62 | |
| RFB | Pearson Correlation | .708** | 1 | .708** | .965** |
| Sig. (2-tailed) | .000 | .000 | .000 | ||
| N | 62 | 62 | 62 | 62 | |
| LFL | Pearson Correlation | .976** | .708** | 1 | .678** |
| Sig. (2-tailed) | .000 | .000 | .000 | ||
| N | 62 | 62 | 62 | 62 | |
| LFB | Pearson Correlation | .670** | .965** | .678** | 1 |
| Sig. (2-tailed) | .000 | .000 | .000 | ||
| N | 62 | 62 | 62 | 62 | |
| Correlations | |||||
|---|---|---|---|---|---|
| RFL | RFB | LFL | LFB | ||
| RFL | Pearson Correlation | 1 | .715** | .986** | .710** |
| Sig. (2-tailed) | .000 | .000 | .000 | ||
| N | 62 | 62 | 62 | 62 | |
| RFB | Pearson Correlation | .715** | 1 | .707** | .975** |
| Sig. (2-tailed) | .000 | .000 | .000 | ||
| N | 62 | 62 | 62 | 62 | |
| LFL | Pearson Correlation | .986** | .707** | 1 | .701** |
| Sig. (2-tailed) | .000 | .000 | .000 | ||
| N | 62 | 62 | 62 | 62 | |
| LFB | Pearson Correlation | .710** | .975** | .701** | 1 |
| Sig. (2-tailed) | .000 | .000 | .000 | ||
| N | 62 | 62 | 62 | 62 | |
| Correlations | |||||
|---|---|---|---|---|---|
| RFL | RFB | LFL | LFB | ||
| RFL | Pearson Correlation | 1 | .730** | .990** | .747** |
| Sig. (2-tailed) | .000 | .000 | .000 | ||
| N | 62 | 62 | 62 | 62 | |
| RFB | Pearson Correlation | .730** | 1 | .722** | .977** |
| Sig. (2-tailed) | .000 | .000 | .000 | ||
| N | 62 | 62 | 62 | 62 | |
| LFL | Pearson Correlation | .990** | .722** | 1 | .743** |
| Sig. (2-tailed) | .000 | .000 | .000 | ||
| N | 62 | 62 | 62 | 62 | |
| LFB | Pearson Correlation | .747** | .977** | .743** | 1 |
| Sig. (2-tailed) | .000 | .000 | .000 | ||
| N | 62 | 62 | 62 | 62 | |
| Correlations | |||||
|---|---|---|---|---|---|
| RFL | RFB | LFL | LFB | ||
| RFL | Pearson Correlation | 1 | .683** | .981** | .664** |
| Sig. (2-tailed) | .000 | .000 | .000 | ||
| N | 66 | 66 | 66 | 66 | |
| RFB | Pearson Correlation | .683** | 1 | .670** | .966** |
| Sig. (2-tailed) | .000 | .000 | .000 | ||
| N | 66 | 66 | 66 | 66 | |
| LFL | Pearson Correlation | .981** | .670** | 1 | .658** |
| Sig. (2-tailed) | .000 | .000 | .000 | ||
| N | 66 | 66 | 66 | 66 | |
| LFB | Pearson Correlation | .664** | .966** | .658** | 1 |
| Sig. (2-tailed) | .000 | .000 | .000 | ||
| N | 66 | 66 | 66 | 66 | |
Effect of Sex and Age on Right Foot Length Measurement
AGE -Age is not significant on the result obtained from the Right FootLength, because the p-value is > 0.05
SEX- Sex is significant on the result obtained from the Right Foot Length, because the p-value is < 0.05 (Table 17)
Table 17. Test of between-subjects effects for right foot length| Parameters | P-Value | Significance Level | Conclusion |
| Age | 0.865 | 0.05 | Not significant |
| Sex | 0.000 | 0.05 | Significant |
Effect of Sex and Age on Right Foot Breadth Measurement
AGE - Age is not significant on the result obtained from the Right Foot Breadth, because the p-value is > 0.05
SEX- Sex is significant on the result obtained from the Right Foot Breadth, because the p-value is < 0.05 (Table 18)
Table 18. Test of between-subjects effects for right foot breadth| Parameters | P-Value | Significance Level | Conclusion |
| Age | 0.501 | 0.05 | Not Significant |
| Sex | 0.000 | 0.05 | Significant |
Effect of Sex and Age on Left Foot Length Measurement
AGE - Age is not significant on the result obtained from the Left Foot Length, because the p-value is > 0.05
SEX- Sex is significant on the result obtained from the Left Foot Length, because the p-value is < 0.05 (Table 19)
Table 19. Test of between-subjects effects for left foot length| Parameters | P-Value | Significance Level | Conclusion |
| Age | 0.669 | 0.05 | Not Significant |
| Sex | 0.000 | 0.05 | Significant |
Effect of Sex and Age on Left Foot Breadth Measurement
AGE - Age is not significant on the result obtained from the Left Foot Breadth, because the p-value is > 0.05
SEX- Sex is significant on the result obtained from the Left Foot Breadth, because the p-value is < 0.05 (Table 20)
(Figure 1)
Table 20. Test of between-subjects effects for left foot breadth| Parameters | P-Value | Significance Level | Conclusion |
| Age | 0.622 | 0.05 | Not Significant |
| Sex | 0.000 | 0.05 | Significant |
Figure 1.Bar Chart of average right foot length against age range (mean±sd)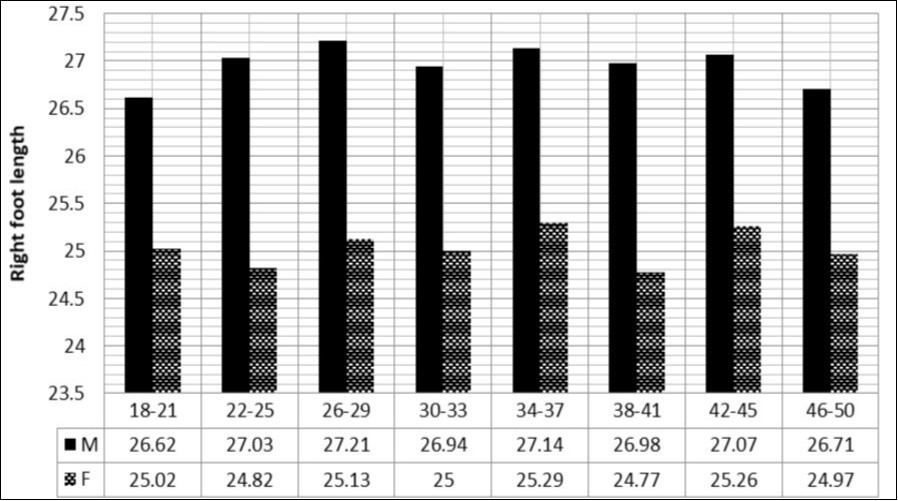
The average length of the male’s right foot is significantly higher in all the age groups than that of the female.
(Figure 2)
Figure 2.Bar chart of average right foot breadth against age range (mean±sd)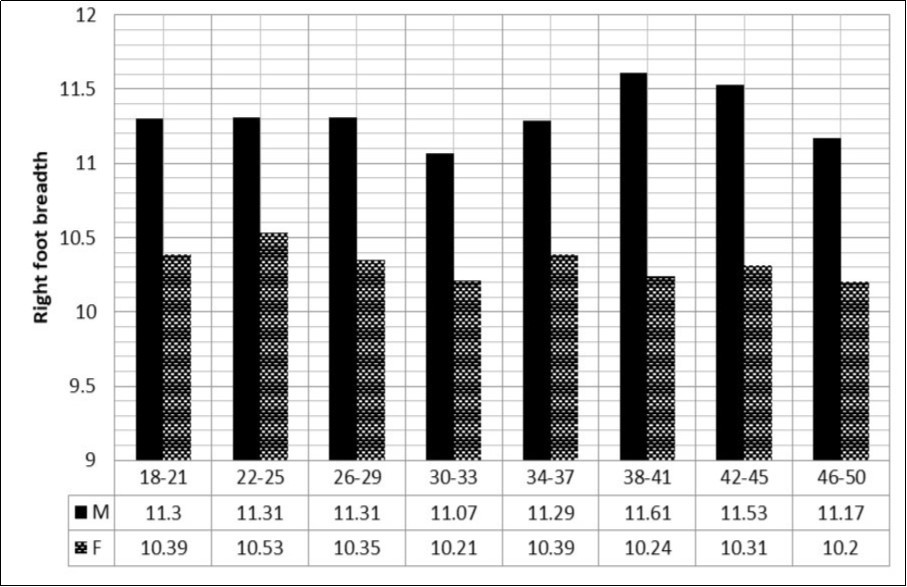
The average breadth of the male’s right foot is significantly higher in all the age groups than that of the female.
(Figure 3)
Figure 3.Bar chart of average left foot length against age range (mean±sd)
The average length of the male’s left foot is significantly higher in all the age groups than that of the female.
(Figure 4)
Figure 4.Bar chart of average left foot breadth against age range (mean±sd)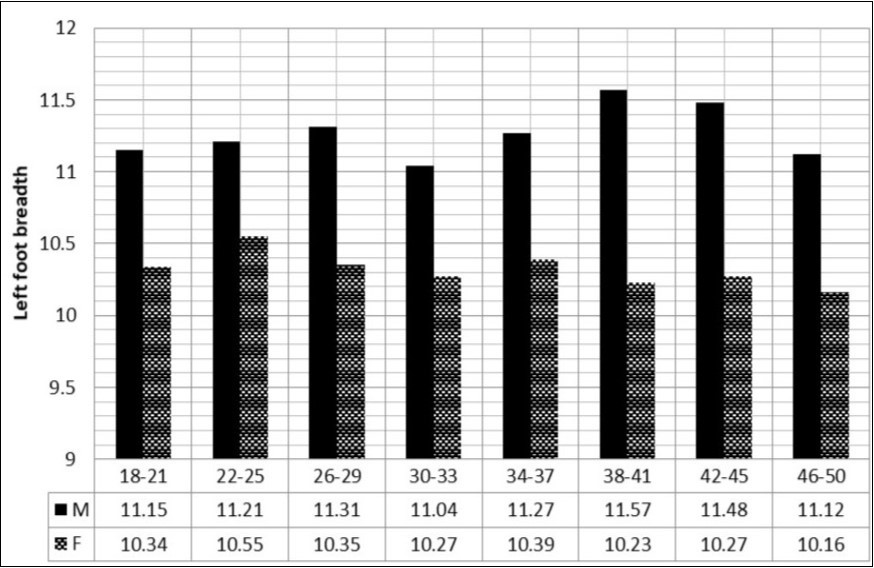
The average breadth of the male’s left foot is significantly higher in all the age groups than that of the female.
(Figure 5)
Figure 5.Bar chart of overall average for measured foot parameters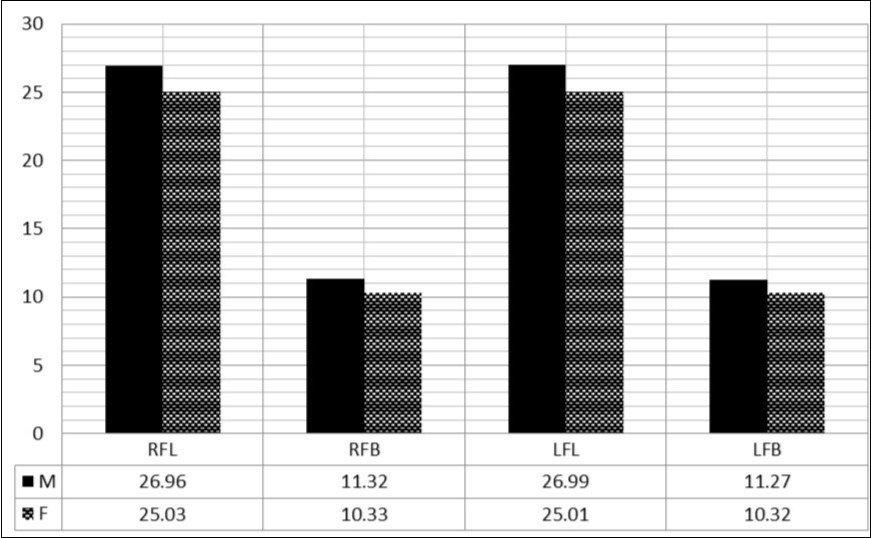
The overall averages of the males’ foot measurements are significantly higher than those of the females.
Discussion
The present study revealed that the males’ average foot length was significantly greater than that of the females while foot breadth in males was significantly greater as compared to females in all age groups. The present study indicates a positive correlation between an individual foot measurements and gender. It also showed consistency with various studies that have been conducted on the estimation of sex from the anthropometric measurements of the foot by many researchers. The study conducted by Agnihotri et al 4 on 250 students (125 males, 125 females) age group 18-30 years in the year 2005 concluded that the average foot length was found to be 3cm greater in males as compared to females and average foot breadth of males was about 1cm broader than females. Sen et al 7 attempted to estimate sex from foot length, foot breadth and foot index among 350 adult Rajbangsi (175 men, 175 women) individuals likewise Tyagi et al 8. They all concluded that foot dimensions show a significant sex difference which supports the present study 8.
Bob-Manuel and Didiain established in their study that the mean value of right foot length in males and females were 26.92±1.02 and 25.00±1.33 and the mean value of right foot breadth for males and females were 9.87±0.53 and 9.14±0.58 9. The mean values for the left foot length of males and females were 26.92±0.13 and 24.75±0.17 respectively. The mean value for the left foot breadth of males and females were 9.75±0.07 and 8.92±0.08 respectively. Males had significantly higher values of foot length and foot breadth than females.
Studies among the Haryanvi jats and North Indian mixed population that Haryanvi males had an average foot length about 2cm greater than females and foot breadth in males was about 1cm greater in males as compared to females while in North Indian mixed population males had an average foot length about 3cm greater than females and the average foot breadth in males was about 1cm greater than in females. Findings in this study are in agreement with their submission 3.
Conclusion
The present study had focused on the assessment of sex from the anthropometric measurements of the foot in Ogbomosho north local government area. It provided the necessary methodology for the estimation of sex from foot dimensions that is of immense value in forensic identifications especially in cases of mass disasters and criminal mutilation. It can be concluded that foot dimensions show significant sex differences and that sex can be estimated from foot dimensions with reasonable accuracy. With the statistical analysis, it can be concluded that any foot with length lesser than 26cm and breadth lesser than 11cm can be suggested to be that of a female while any foot with length greater than 26cm and breadth greater than 11cm can be suggested to be that of a male. Therefore, 26cm can be taken as the cut-off point for foot length and 11cm as the cut-off point for foot breadth in this locality.
References
- 2.Moudi M A. Medical Sciences University of Mazandaran, Mazandaran (1996) Anthropometric Engineering. , Iran 21-45.
- 3.Singla R, Bedi M, Biswas M. (2012) Sex estimation from foot anthropometry in haryanvijats and north indian mixed population. , J Punjab Acad Forensic Med Toxicol 12(1), 13-6.
- 4.A K, Shukla S, Purwar B. (2007) Determination of sex from the foot measurements. , The Internet Journal of Forensic Science 2, 1.
- 5.Sen J, Kanchan T, Ghosh S. (2011) Sex estimation from foot dimensions in an Indigenous Indian population. J Forensic Sci. 56-51.
- 6.A K Tyagi, Mukta Rani, Kohli A. (2004) Sexing by foot index (2000-2001).Journal of Forensic Medicine and Toxicology. Jan-Jun. 21(1), 10-11.
- 7.I F Bob-Manuel, B C Didia. (2009) Sexual dimorphism in foot dimensions among adult Nigerians. , The Internet Journal of Biological Anthropology 3, 1.
Cited by (1)
This article has been cited by 1 scholarly work according to:
Citing Articles:
Nairrita Bhattacharjee, Suvendu Maji, Baidyanath Pal, Monali Goswami - Papers on Anthropology (2024) Semantic Scholar